

Serotonin is elevated in risk-genotype carriers of TCF7L2 - rs7903146
- PMID: 31492908
- PMCID: PMC6731216
- DOI: 10.1038/s41598-019-49347-y
Serotonin is elevated in risk-genotype carriers of TCF7L2 - rs7903146
Abstract
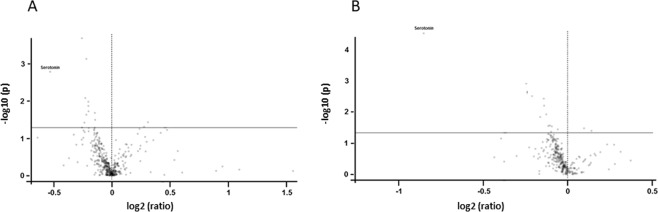
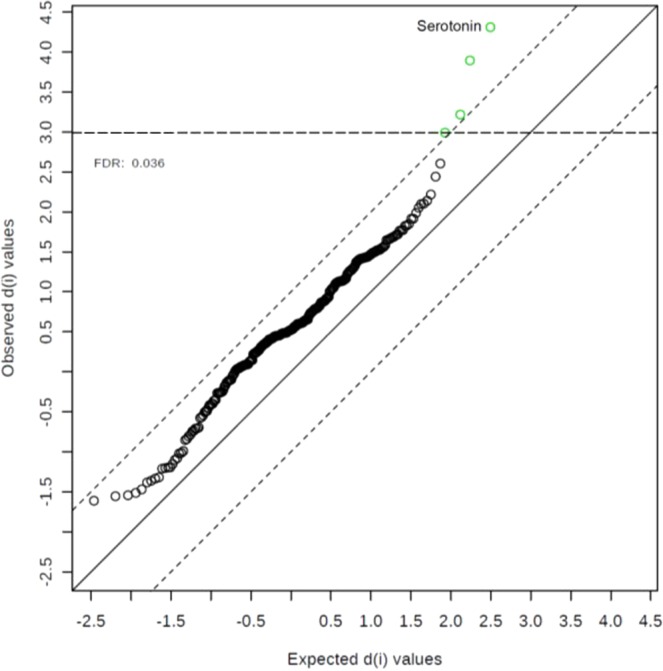
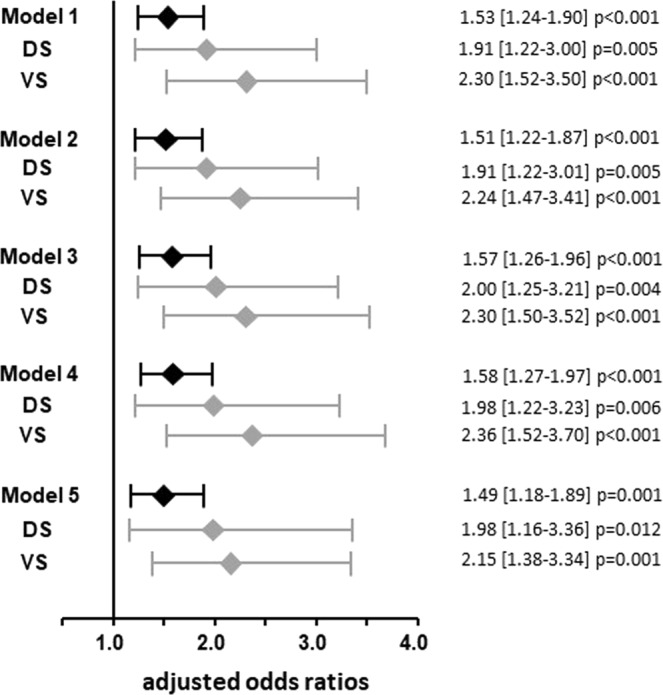
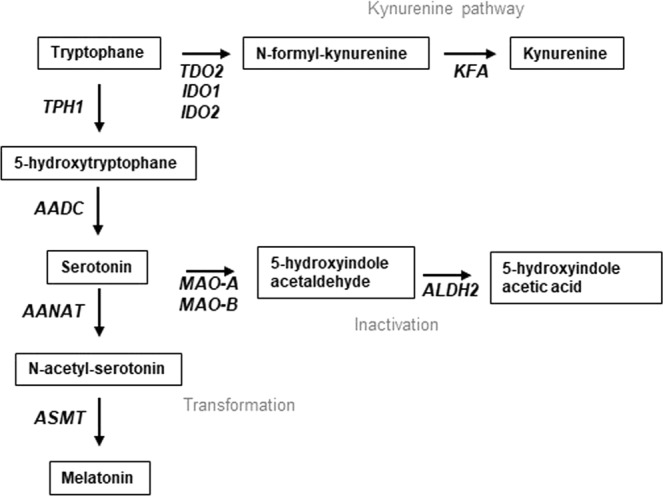
The transcription factor 7-like 2 (TCF7L2) polymorphism rs7903146 is known to be tightly associated with an elevated risk for type 2 diabetes, whereas the molecular mechanisms remain elusive. We evaluated the metabolic profile of a total of 394 patients' serum samples with respect to their rs7903146 genotype using targeted metabolomics in a discovery (n = 154) and a validation (n = 240) study. We have identified serotonin as the top metabolite being increased in carriers of the risk allele. Serotonin was significantly associated with the rs7903146 genotype after full adjustment including type 2 diabetes and further top ranked metabolites. Given the role of peripheral serotonin in metabolic homeostasis and type 2 diabetes, this finding provides a first hint that the well-known impact of the TCF7L2 polymorphism on type 2 diabetes risk may involve a serotonin-dependent pathway.
Conflict of interest statement
The authors declare no competing interests.
Figures
Similar articles
-
Association of rs7903146, rs12255372, and rs290487 polymorphisms in TCF7L2 gene with type 2 diabetes in an Iranian Kurdish ethnic group.Clin Lab. 2014;60(8):1269-76. doi: 10.7754/clin.lab.2013.130809. Clin Lab. 2014. PMID: 25185411
-
Plasma metabolomics reveal alterations of sphingo- and glycerophospholipid levels in non-diabetic carriers of the transcription factor 7-like 2 polymorphism rs7903146.PLoS One. 2013 Oct 24;8(10):e78430. doi: 10.1371/journal.pone.0078430. eCollection 2013. PLoS One. 2013. PMID: 24205231 Free PMC article.
-
[Association of the TCF7L2 (RS7903146) genotype with adiposity and metabolic markers in the Chilean adult population].Rev Med Chil. 2019 Aug;147(8):965-976. doi: 10.4067/S0034-98872019000800965. Rev Med Chil. 2019. PMID: 31859960 Spanish.
-
The Protective Effect of Transcription Factor 7-Like 2 Risk Allele rs7903146 against Elevated Fasting Plasma Triglyceride in Type 2 Diabetes: A Meta-Analysis.J Diabetes Res. 2015;2015:468627. doi: 10.1155/2015/468627. Epub 2015 Oct 4. J Diabetes Res. 2015. PMID: 26576435 Free PMC article. Review.
-
The Role of TCF7L2 rs7903146 in Diabetes After Kidney Transplant: Results From a Single-Center Cohort and Meta-Analysis of the Literature.Transplantation. 2016 Aug;100(8):1750-8. doi: 10.1097/TP.0000000000000978. Transplantation. 2016. PMID: 26555947 Review.
Cited by
-
Pharmacometabolomics of sulfonylureas in patients with type 2 diabetes: a cross-sectional study.J Pharm Pharm Sci. 2024 Sep 17;27:13305. doi: 10.3389/jpps.2024.13305. eCollection 2024. J Pharm Pharm Sci. 2024. PMID: 39355646 Free PMC article.
-
Estimating the Direct Effect between Dietary Macronutrients and Cardiometabolic Disease, Accounting for Mediation by Adiposity and Physical Activity.Nutrients. 2022 Mar 13;14(6):1218. doi: 10.3390/nu14061218. Nutrients. 2022. PMID: 35334875 Free PMC article.
-
Machine Learning Approach to Metabolomic Data Predicts Type 2 Diabetes Mellitus Incidence.Int J Mol Sci. 2024 May 14;25(10):5331. doi: 10.3390/ijms25105331. Int J Mol Sci. 2024. PMID: 38791370 Free PMC article.
