. 2019 Sep 6;9(1):12830.
doi: 10.1038/s41598-019-49073-5.

Experimentally-driven mathematical modeling to improve combination targeted and cytotoxic therapy for HER2+ breast cancer

Affiliations

Experimentally-driven mathematical modeling to improve combination targeted and cytotoxic therapy for HER2+ breast cancer

Angela M Jarrett et al. Sci Rep. .

Abstract

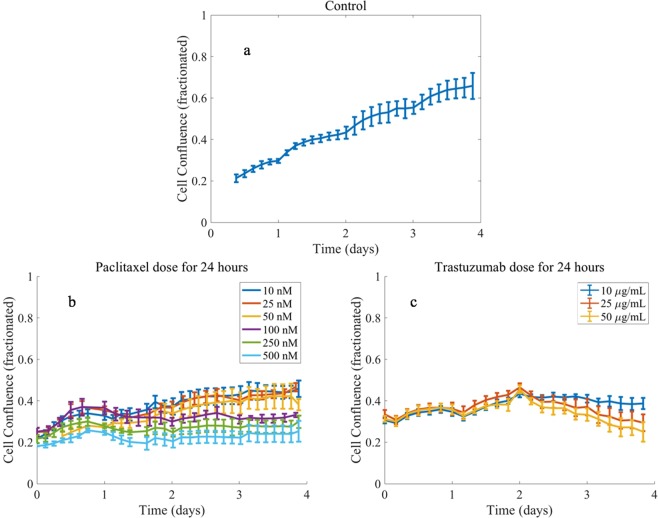
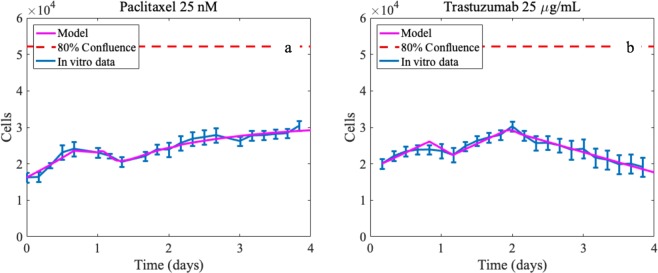
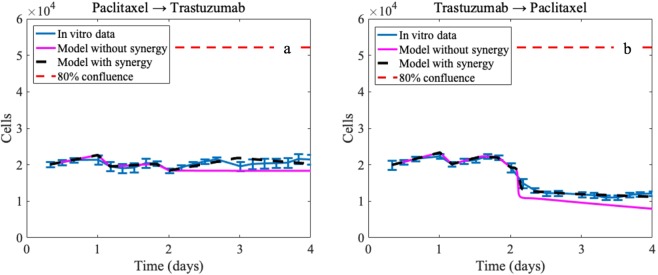
The goal of this study is to experimentally and computationally investigate combination trastuzumab-paclitaxel therapies and identify potential synergistic effects due to sequencing of the therapies with in vitro imaging and mathematical modeling. Longitudinal alterations in cell confluence are reported for an in vitro model of BT474 HER2+ breast cancer cells following various dosages and timings of paclitaxel and trastuzumab combination regimens. Results of combination drug regimens are evaluated for drug interaction relationships based on order, timing, and quantity of dose of the drugs. Altering the order of treatments, with the same total therapeutic dose, provided significant changes in overall cell confluence (p < 0.001). Two mathematical models are introduced that are constrained by the in vitro data to simulate the tumor cell response to the individual therapies. A collective model merging the two individual drug response models was designed to investigate the potential mechanisms of synergy for paclitaxel-trastuzumab combinations. This collective model shows increased synergy for regimens where trastuzumab is administered prior to paclitaxel and suggests trastuzumab accelerates the cytotoxic effects of paclitaxel. The synergy derived from the model is found to be in agreement with the combination index, where both indicate a spectrum of additive and synergistic interactions between the two drugs dependent on their dose order. The combined in vitro results and development of a mathematical model of drug synergy has potential to evaluate and improve standard-of-care combination therapies in cancer.


Conflict of interest statement

The authors declare no competing interests.

Figures

Figure 1
Figure 1
A schematic of the strategy for integrating the experimental evidence with the mathematical models. The logistic model is calibrated to control data to determine ranges for growth and carrying capacity parameters for the cell line. Each single drug model is calibrated to each of the corresponding single drug dose data sets (six sets for paclitaxel, three sets for trastuzumab) using the parameter ranges from the controls to determine the inherent growth and carrying capacity values using the first 24 (drug free) hours for each data set. The combined model utilizes both the ranges generated from controls as well as the parameter values generated by the single drug dose models for the corresponding dosages for the combination drug data sets (indicated with dashed boxes). This combined model is calibrated with an added synergistic parameter to assess potential synergistic effects based on its values for different sequences and dosages of combination therapy.
Figure 2
Figure 2
A schematic of the sequential calibration method for single drugs and combination drug regimens that administer the two drugs consecutively and simultaneously, as defined in the in vitro experimental timeline. For all calibration scenarios, parameters k and θ are calibrated using the first 24 hours of data within parameter intervals determined from the control data sets. For combination drug regimens, the apart from the synergy parameter, S, drug associated parameter undergo a small recalibration. This small recalibration is labeled as “tuning” because the parameter values were only allowed to vary within small, predetermined intervals about the calibrated values for the single drug dose sets for the paclitaxel and trastuzumab treatment. These intervals are defined using the calibration errors calculated for each parameter from the calibration verification study.
Figure 3
Figure 3
Comparison of one control (panel a) and varying drug doses for paclitaxel (panel b) and trastuzumab (panel c) administered individually. Data points are the mean of the data across replicates with 95% confidence intervals represented with error bars. Drugs are applied at day 1 and allowed to remain on the cells for 24 hours. After 24 hours the drug is removed, and media changed. Note that paclitaxel has an immediate effect on the tumor cell number compared to trastuzumab which had a delayed effect.
Figure 4
Figure 4
Comparison of combination regimens for two different dosages of paclitaxel (25 and 100 nM) with trastuzumab (panel a). Panel b depicts sequential combination regimens where either paclitaxel (Pac) or trastuzumab (TmAb, doses are μg/mL) is applied first on day 1, then at day 2 the media is changed, and the second drug is applied; finally, after 24 hours (day 3) the second drug is also removed, and the media changed. Note the significant difference by day 4 between the sequences where paclitaxel is administered first versus trastuzumab first. Panel c shows the results for the drugs applied simultaneously for 24 hours (day 1 to day 2) for two different paclitaxel doses.
Figure 5
Figure 5
Example fits for the mathematical model after being calibrated to the individual drug doses for paclitaxel and trastuzumab. (Panel a) paclitaxel 25 nM with CCC = 0.98 and (b) trastuzumab 25 μg/mL with CCC = 0.96 between the model simulation and the data. Note that the experimental confluence values are converted to approximate number of tumor cells to simulate the model.
Figure 6
Figure 6
Example simulations of the mathematical model for two different combination regimens (both with paclitaxel 25 nM and trastuzumab 25 μg/mL). Panel (a) corresponds to results for the paclitaxel added prior to trastuzumab experimental sets, and panel (b) corresponds to results for the trastuzumab added prior to paclitaxel experimental sets. Panel (a) shows the results for the model simulation where the parameters from the single drug doses are used explicitly and synergy is not considered (CCC = 0.23) as well as the results for the model simulation where the synergy parameter is included in the recalibration (CCC = 0.61). Similarly, for panel (b), the results for the model simulation where the parameters from the single drug doses are used explicitly CCC = 0.94, whereas the results for the model simulation where the synergy parameter is included in the recalibration CCC = 0.99. Note that the experimental confluence values are converted to approximate number of tumor cells to simulate the model.

Similar articles

Cited by

References

    1. Foucquier J, Guedj M. Analysis of drug combinations: current methodological landscape. Pharmacol Res Perspect. 2015;3(3):e00149. doi: 10.1002/prp2.149. - DOI - PMC - PubMed
    1. McKenna MT, et al. Precision Medicine with Imprecise Therapy: Computational Modeling for Chemotherapy in Breast Cancer. Transl Oncol. 2018;11(3):732–742. doi: 10.1016/j.tranon.2018.03.009. - DOI - PMC - PubMed
    1. Yankeelov TE, et al. Toward a Science of Tumor Forecasting for Clinical Oncology. Cancer Research. 2015;75(6):918–923. doi: 10.1158/0008-5472.CAN-14-2233. - DOI - PMC - PubMed
    1. Mitri Z, Constantine T, O’Regan R. The HER2 Receptor in Breast Cancer: Pathophysiology, Clinical Use, and New Advances in Therapy. Chemother Res Pract. 2012;2012:743193. - PMC - PubMed
    1. American Cancer Society. Breast Cancer Facts & Figures 2017–2018. American Cancer Society: Atlanta (2017).

Publication types

MeSH terms