. 2019 Sep 6;9(1):12860.
doi: 10.1038/s41598-019-49009-z.

L-Type Amino Acid Transporter 1 (LAT1/Lat1)-Utilizing Prodrugs Can Improve the Delivery of Drugs into Neurons, Astrocytes and Microglia

Affiliations

L-Type Amino Acid Transporter 1 (LAT1/Lat1)-Utilizing Prodrugs Can Improve the Delivery of Drugs into Neurons, Astrocytes and Microglia

Johanna Huttunen et al. Sci Rep. .

Abstract

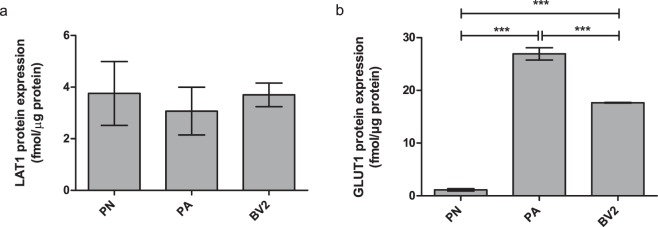
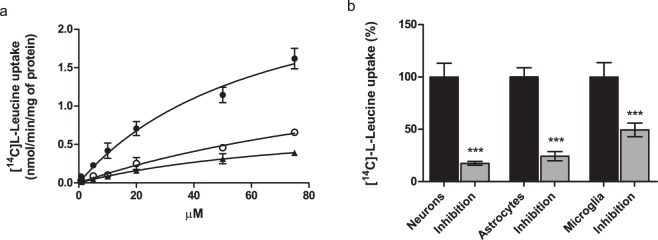
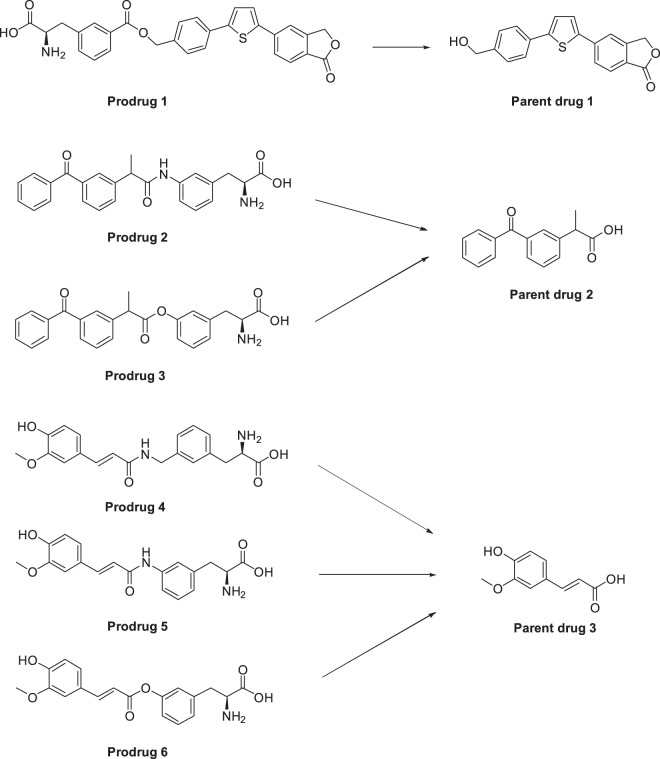
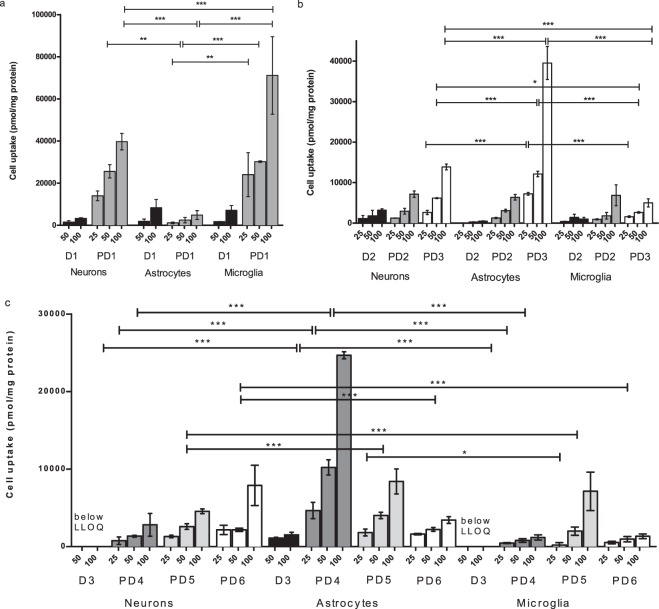
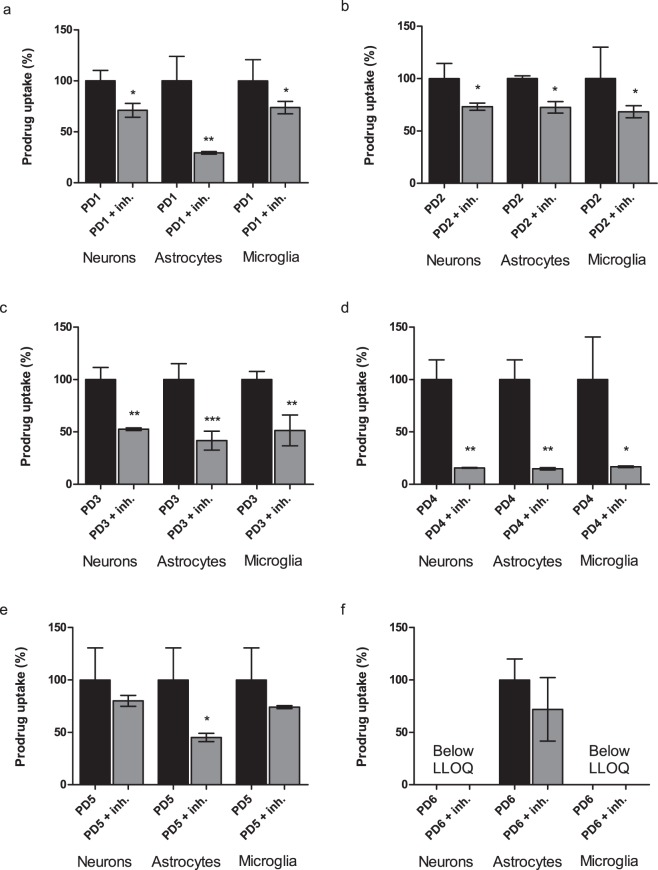
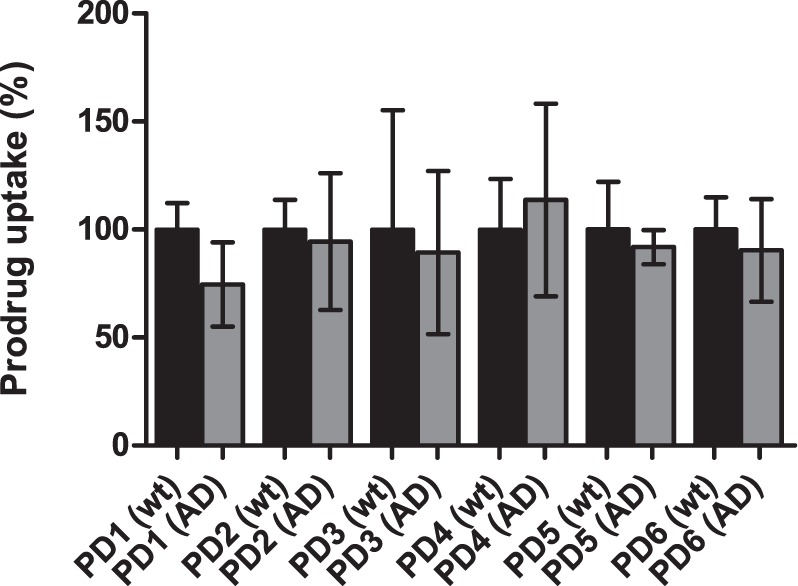
L-Type Amino Acid Transporter 1 (LAT1/Lat1) is responsible for carrying large, neutral L-amino acids as well as several drugs and prodrugs across the blood-brain barrier (BBB). However, the BBB is not the only barrier that hinders drugs acting effectively within the brain; the brain parenchymal cell membranes represent a secondary barrier for the drugs with intracellular target sites. In this study, expression and function of Lat1 was quantified in mouse primary neuron, astrocyte and immortalized microglia (BV2) cultures. Moreover, ability of Lat1 to carry prodrugs inside these brain cells was evaluated. The results showed that Lat1 was localized at the similar level in all studied cells (3.07 ± 0.92-3.77 ± 0.91 fmol/µg protein). The transporter was also functional in all three cell types, astrocytes having the highest transport capacity and affinity for the LAT1/Lat1-substrate, [14C]-L-leucine, followed by neurons and microglia. The designed prodrugs (1-6) were able to utilize Lat1 for their cellular uptake and it was mainly much higher than the one of their parent drugs. Interestingly, improved cellular uptake was also achieved in cells representing Alzheimer's Disease phenotype. Therefore, improved delivery and intra-brain targeting of drugs can be attained by utilizing LAT1/Lat1 and prodrug approach.


Conflict of interest statement

The authors declare no competing interests.

Figures

Figure 1
Figure 1
(a) Lat1 and b) Glut1 expression levels in mouse primary neurons (PN) and astrocytes (PA), as well as in immortalized microglia (BV2) determined from the crude membrane fractions and measured by SMR/MSM analysis. The data is presented as mean ± SD, n = 3 (***P < 0.001, one-way ANOVA, followed by Tuckey’s multiple comparison test).
Figure 2
Figure 2
(a) Cellular uptake of [14C]-L-Leu into the mouse primary neurons (○ open circles) and astrocytes (• filled circles), and immortalized microglias (▴ triangles facing upwards) over a concentration range of 0.76–75 µM. (b) Uptake of 0.76 µM [14C]-L-Leu into neurons, astrocytes and microglia with and without 100 µM LAT1/Lat1-inhibitor presented as percentages (%) of [14C]-L-Leu uptake, in which the control (100%) is the uptake without the inhibitor. The data is presented as mean ± SD, n = 9 (***P < 0.001, one-way ANOVA, followed by Tuckey’s multiple comparison test).
Figure 3
Figure 3
Molecular structures of studied compounds; LAT1/Lat1-utilizing prodrugs 16 and their maternal drugs 13.
Figure 4
Figure 4
(ac) Cellular uptake of 25, 50 and 100 µM prodrugs 16 (PD1-6) and their parent drugs 13 (D1-3) into mouse primary neurons and astrocytes, as well as immortalized microglia. The data is presented as mean ± SD, n = 9 and the statistical difference is evaluated only among prodrug uptake into different cell types (*P < 0.05, **P < 0.01, ***P < 0.001, one-way ANOVA, followed by Tuckey’s multiple comparison test).
Figure 5
Figure 5
(af) Cellular uptake of 1–10 µM prodrugs 16 into primary neurons and astrocytes and immortalized microglia in the absence (black bars) and the presence (grey bars) of 100 µM LAT1/Lat1-inhibitor presented as percentages (%) of prodrug uptake, in which the control (100%) is the uptake without the inhibitor. The data is presented as mean ± SD, n = 9 (*P < 0.05, **P < 0.01, one-way ANOVA, followed by Tuckey’s multiple comparison test).
Figure 6
Figure 6
Cellular uptake of 50 µM prodrugs 16 into primary astrocytes of wild type (wt; black bars) and transgenic AD-astrocytes (grey bars) presented as percentages (%) of prodrug uptake, in which the control (100%) is the uptake without the inhibitor. The data is presented as mean ± SD, n = 9 (no statistically difference, one-way ANOVA, followed by Tuckey’s multiple comparison test).

References

    1. Pangalos MN, Schechter LE, Hurko O. Drug development for CNS disorders: strategies for balancing risk and reducing attrition. Nat Rev Drug Discov. 2007;6:521–532. doi: 10.1038/nrd2094. - DOI - PubMed
    1. Pankevich DE, Altevogt BM, Dunlop J, Gage FH, Hyman SE. Improving and accelerating drug development for nervous system disorders. Neuron. 2014;84:546–553. doi: 10.1016/j.neuron.2014.10.007. - DOI - PMC - PubMed
    1. Kesselheim AS, Hwang TJ, Franklin JM. Two decades of new drug development for central nervous system disorders. Nat Rev Drug Discov. 2015;14:815–816. doi: 10.1038/nrd4793. - DOI - PubMed
    1. Pardridge WM. Drug transport across the blood-brain barrier. J Cereb Blood Flow Metab. 2012;32:1959–1972. doi: 10.1038/jcbfm.2012.126. - DOI - PMC - PubMed
    1. Lee G, Dallas S, Hong M, Bendayan R. Drug transporters in the central nervous system: brain barriers and brain parenchyma considerations. Pharmacol Rev. 2001;53:569–596. doi: 10.1146/annurev.pharmtox.41.1.569. - DOI - PubMed

Publication types

MeSH terms

Substances