. 2020;9(1):161-183.
doi: 10.1016/j.jcmgh.2019.08.011. Epub 2019 Sep 5.

Transcriptomic Dissection of Hepatocyte Heterogeneity: Linking Ploidy, Zonation, and Stem/Progenitor Cell Characteristics

Affiliations

Transcriptomic Dissection of Hepatocyte Heterogeneity: Linking Ploidy, Zonation, and Stem/Progenitor Cell Characteristics

Takeshi Katsuda et al. Cell Mol Gastroenterol Hepatol. 2020.

Abstract

Background & aims: There is a long-standing debate regarding the biological significance of polyploidy in hepatocytes. Recent studies have provided increasing evidence that hepatocytes with different ploidy statuses behave differently in a context-dependent manner (eg, susceptibility to oncogenesis, regenerative ability after injury, and in vitro proliferative capacity). However, their overall transcriptomic differences in a physiological context is not known.

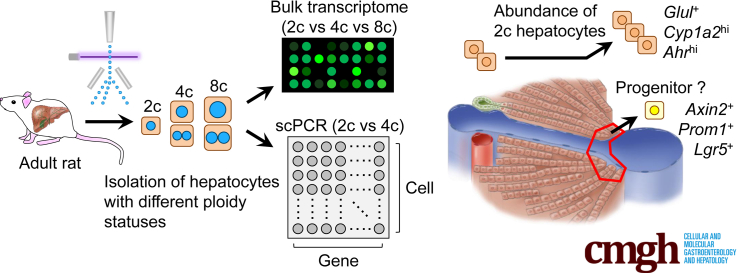
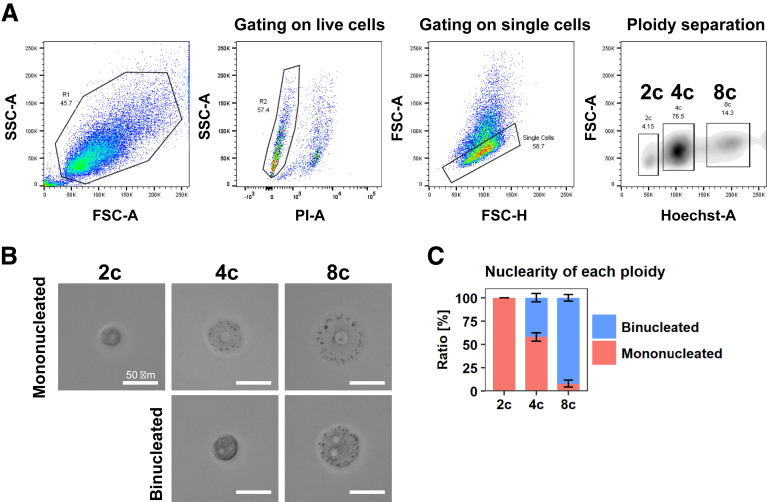
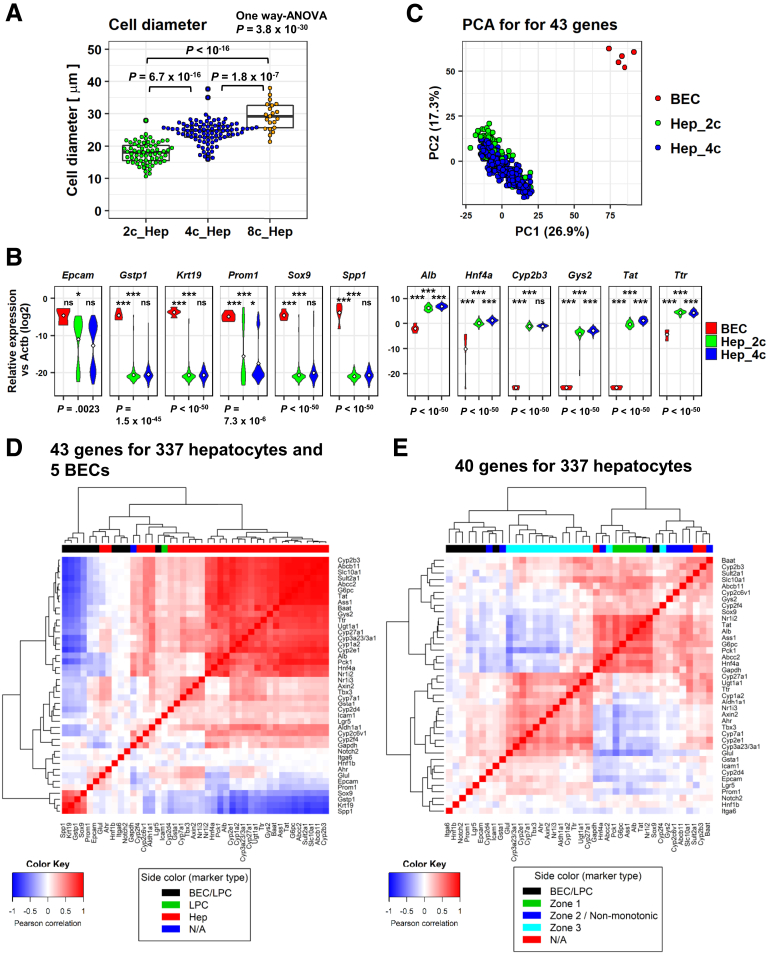
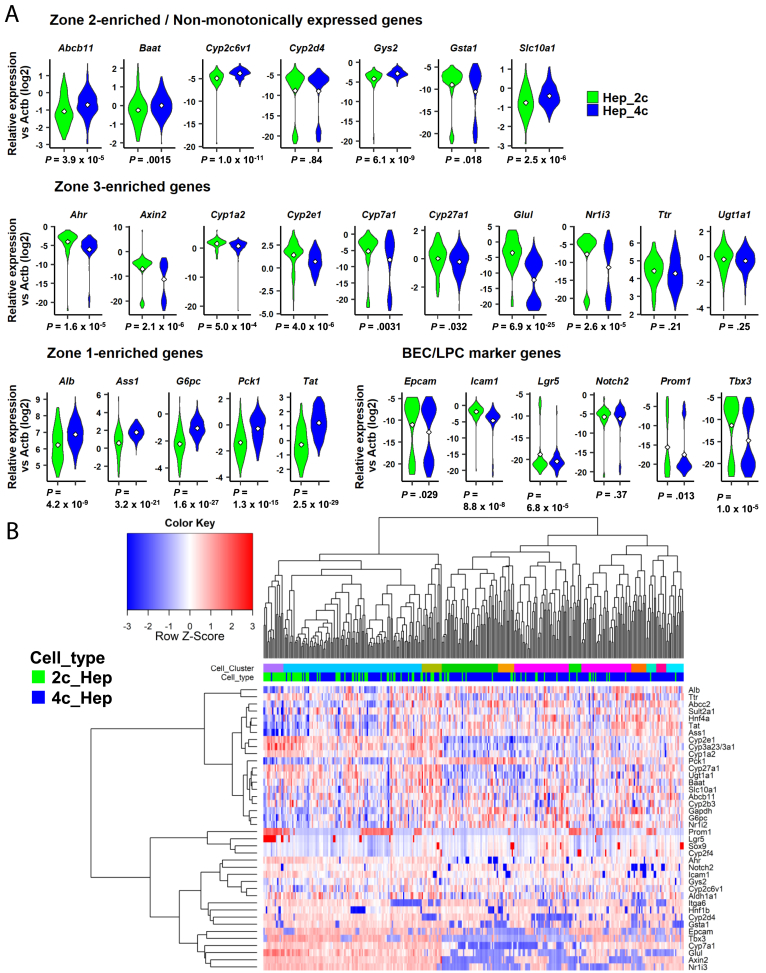
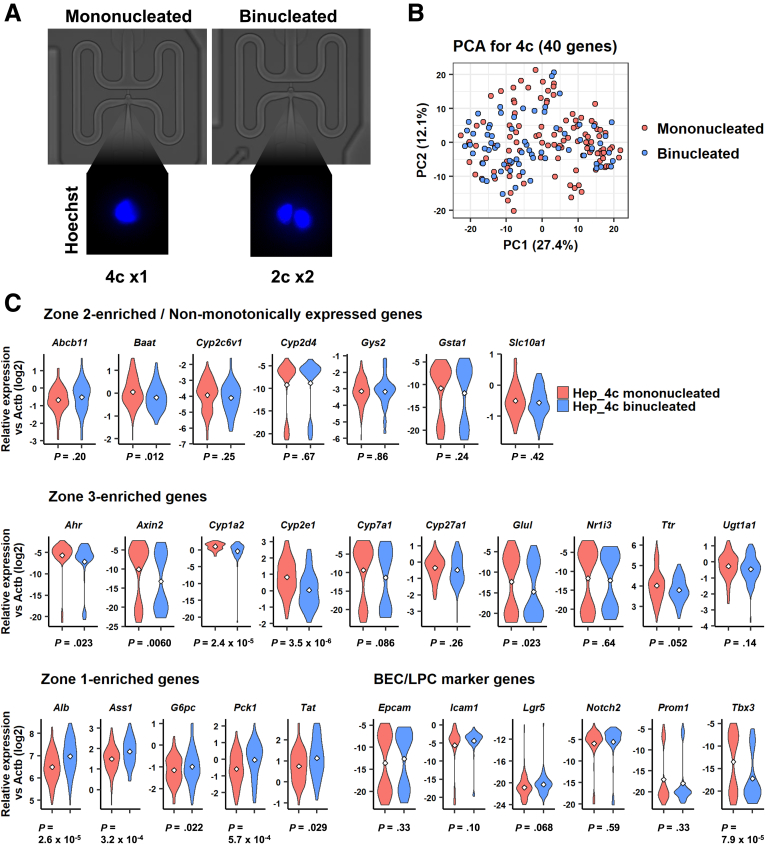
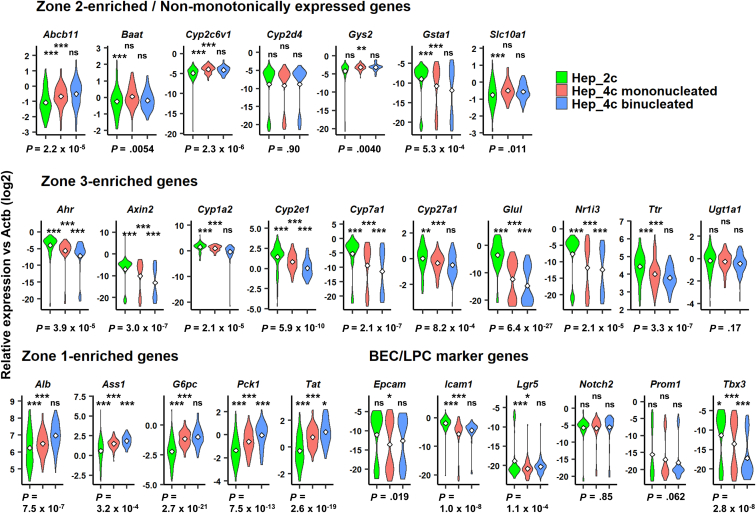
Methods: By using microarray transcriptome analysis, we investigated the heterogeneity of hepatocyte populations with different ploidy statuses. Moreover, by using single-cell quantitative reverse-transcription polymerase chain reaction (scPCR) analysis, we investigated the intrapopulational transcriptome heterogeneity of 2c and 4c hepatocytes.

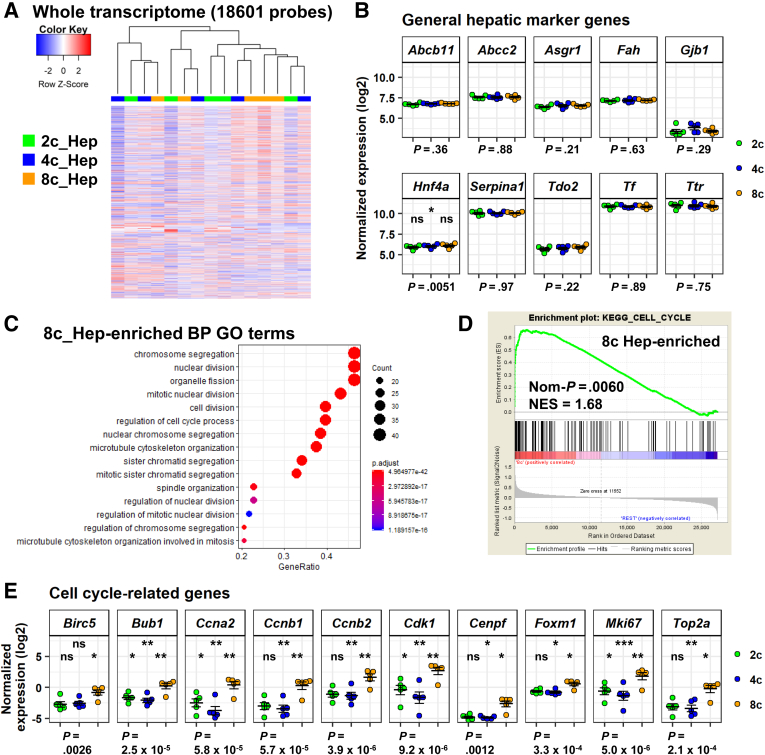
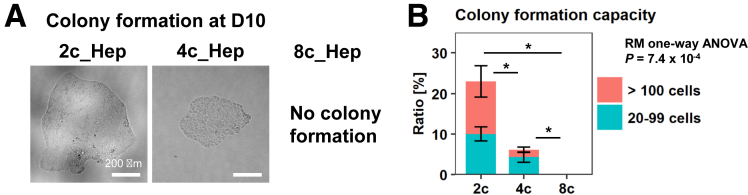
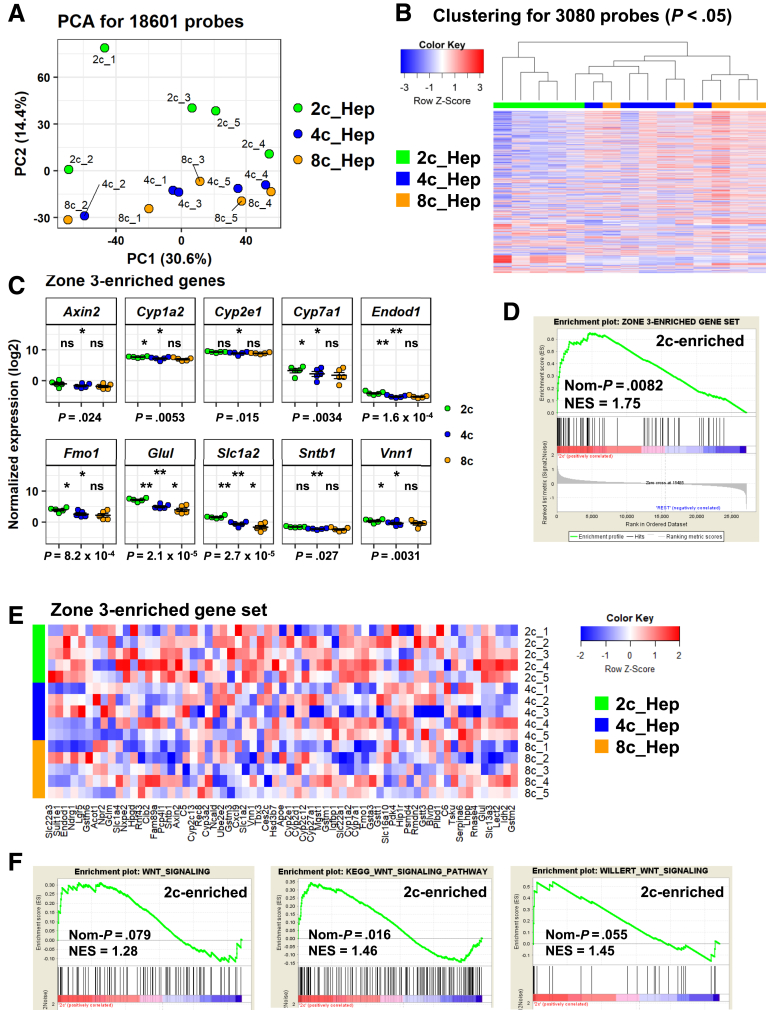
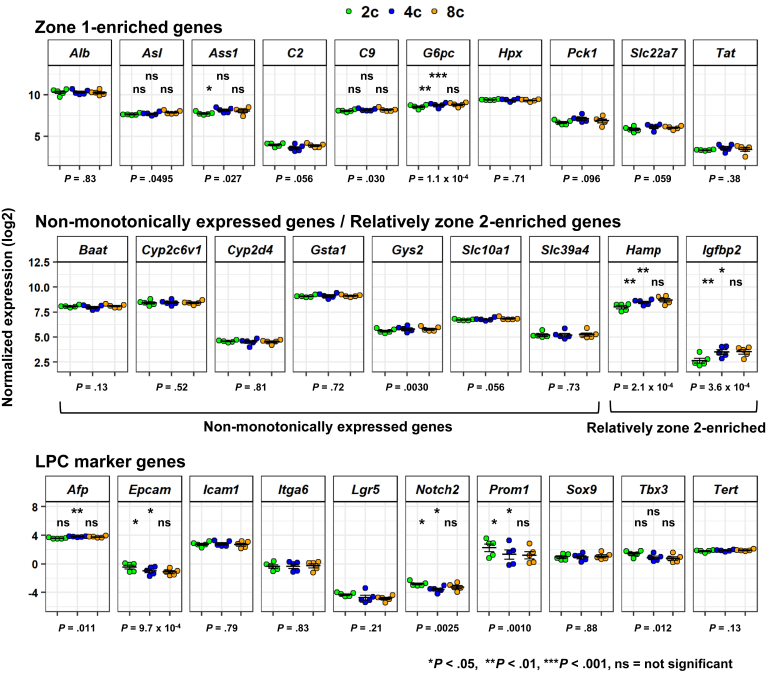
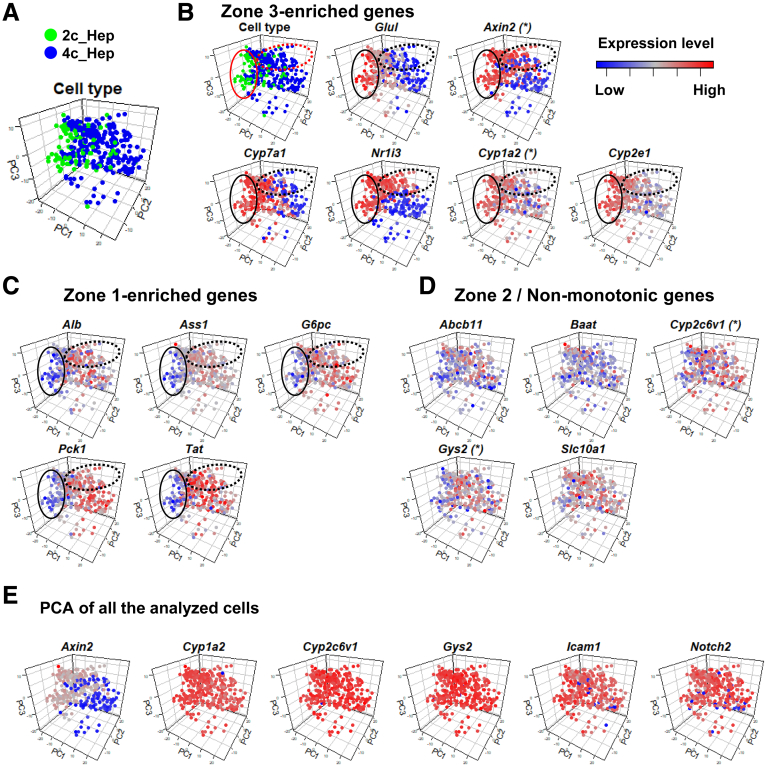
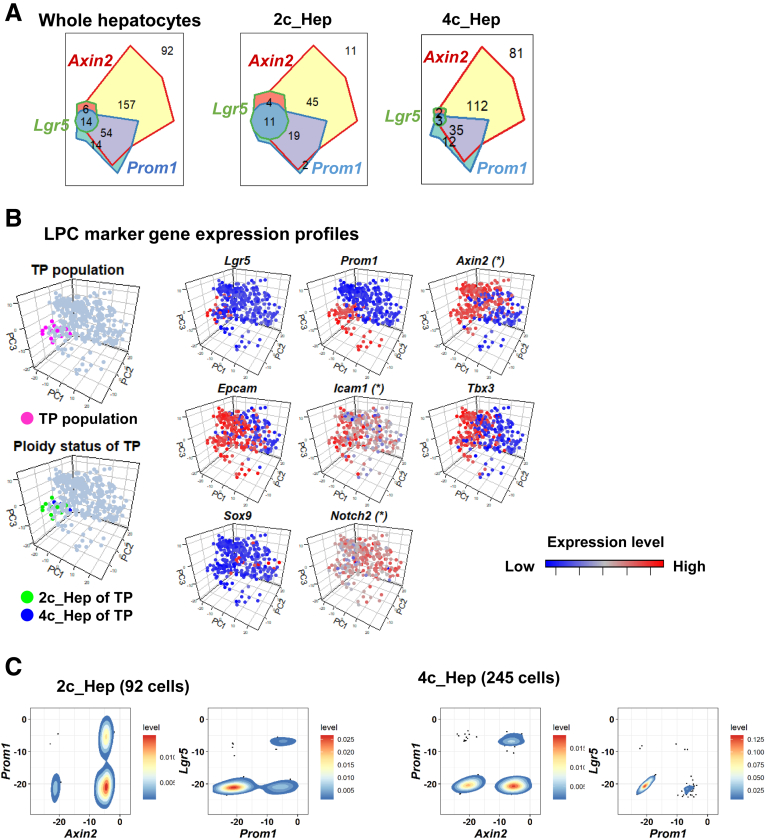
Results: Microarray analysis showed that cell cycle-related genes were enriched in 8c hepatocytes, which is in line with the established notion that polyploidy is formed via cell division failure. Surprisingly, in contrast to the general consensus that 2c hepatocytes reside in the periportal region, in our bulk transcriptome and scPCR analyses, the 2c hepatocytes consistently showed pericentral hepatocyte-enriched characteristics. In addition, scPCR analysis identified a subpopulation within the 2c hepatocytes that co-express the liver progenitor cell markers Axin2, Prom1, and Lgr5, implying the potential biological relevance of this subpopulation.

Conclusions: This study provides new insights into hepatocyte heterogeneity, namely 2c hepatocytes are preferentially localized to the pericentral region, and a subpopulation of 2c hepatocytes show liver progenitor cell-like features in terms of liver progenitor cell marker expression (Axin2, Prom1, and Lgr5).

Keywords: Hepatocyte; Ploidy; Single-Cell PCR; Transcriptome; Zonation.


Figures

None
Graphical abstract
Figure 1
Figure 1
Validation of FACS sorting of hepatocytes with different ploidy statuses. (A) Representative gating for rat hepatocytes with 2c, 4c, and 8c DNA content as assessed by Hoechst 33342 fluorescent intensity. (B) Representative images of single-sorted 2c, 4c, and 8c hepatocytes. Ploidy statuses of the sorted hepatocytes were validated via microscopy on day 1 after plating. Images were taken using the BZX-710 microscope (Keyence). (C) Microscopic validation of nuclear numbers of hepatocytes. The data indicate the means ± SEM of 4 independent experiments. FSC-A, forward scatter-area; FSC-H, forward scatter-height; PI-A, propidium iodide-area; SSC-A, side scatter-area.
Figure 2
Figure 2
Microarray transcriptome analysis of rat hepatocytes with different ploidy statuses. (A) Heatmap with hierarchical clustering of whole-transcriptome analysis of 18,601 probes. Experiments were performed with 5 rats. (B) Expression of general hepatocyte marker genes. Data are means ± SEM (n = 5). (C) 8c hepatocyte-enriched pathways with GO terms (biological process) are shown. Dots represent term enrichment with color coding. The sizes of the dots represent the percentage of each GO term. (D) Gene signature enrichment analysis of 8c hepatocytes and 2c and 4c hepatocytes using the KEGG cell-cycle gene set. (E) Expression of cell cycle–related genes. Data are means ± SEM (n = 5). (B and E) Bottom: P values were calculated by RM 1-way ANOVA, followed by the Holm multiple comparisons test. P values for post hoc tests are presented as follows: *P < .05, **P < .01, ***P < .001. Significance symbols on the left, middle, and right in each panel indicate the comparison between 2c and 4c hepatocytes, 2c and 8c hepatocytes, and 4c and 8c hepatocytes, respectively. BP, biological process; KEGG, Kyoto Encyclopedia of Genes and Genomes; Nom, nominal.
Figure 3
Figure 3
In vitro phenotypic validation of FACS-sorted hepatocytes. (A) Colony formation assay with single-sorted 2c, 4c, and 8c hepatocytes. Images were taken using the BZX-710 microscope (Keyence). (B) Colony-forming capacity was evaluated on day 10. Colonies with 20 or more cells were counted for each fraction. The data are shown as means ± SEM (n = 4). RM 1-way ANOVA was used to determine significant differences among the 3 groups (P = 7.4 × 10-4), followed by the Tukey–Kramer post hoc test as indicated in the panel. *P < .05. D, day.
Figure 4
Figure 4
Characterization of differentially expressed genes in 2c, 4c, and 8c hepatocytes. (A) PCA for whole-transcriptome analysis of 18,601 probes. Labels for each plot provide the ploidy information (2c, 4c, and 8c) with batch information of 5 experiments (_1, _2, _3, _4, and _5). (B) Heatmap with hierarchical clustering of the 3080 differentially expressed probes (defined as probes with P < .05 by RM 1-way ANOVA). (C) Expression of zone 3–enriched genes. Data are represented as means ± SEM (n = 5). P values at the bottom of each panel were calculated by RM 1-way ANOVA, followed by the Holm multiple comparisons test. P values for post hoc tests are presented as follows: *P < .05, **P < 0.01. Significance symbols on the left, middle, and right in each panel indicate the comparison between 2c and 4c hepatocytes, 2c and 8c hepatocytes, and 4c and 8c hepatocytes, respectively. (D) Gene signature enrichment analysis of 2c hepatocytes and 4c and 8c hepatocytes using a zone 3 signature gene set that was generated manually (the gene list is shown in panel E). (E) Heatmap of the zone 3–enriched gene set. (F) Gene signature enrichment analysis of 2c hepatocytes compared with 4c and 8c hepatocytes using Wnt signaling gene sets. KEGG, Kyoto Encyclopedia of Genes and Genomes; NES, Gene Set Enrichment Analysis; Nom, nominal.
Figure 5
Figure 5
Further characterization of FACS-sorted hepatocytes. Expression of zone 1–enriched genes (top), nonmonotonically expressed or relatively zone 2–enriched genes (middle), and LPC marker genes (bottom). Data are represented as means ± SEM (n = 5). Bottom: P values were calculated by RM 1-way ANOVA, followed by the Holm multiple comparisons test. P values for post hoc tests are presented as follows: *P < .05, **P < .01, ***P < .001. Significance symbols on the left, middle, and right in each panel indicate the comparison between 2c and 4c hepatocytes, 2c and 8c hepatocytes, and 4c and 8c hepatocytes, respectively.
Figure 6
Figure 6
Validation of the results of scPCR. (A) Cell size of FACS-sorted 2c, 4c, and 8c hepatocytes. A total of 65, 88, and 21 cells were analyzed for 2c, 4c, and 8c cells, respectively. One-way ANOVA was used to determine significant differences among the 3 groups (P = 3.8 × 10-30), followed by the Tukey multiple comparisons test. (B) Violin plots of BEC marker genes (left) and hepatocyte marker genes (right). Bottom: P values were calculated by 1-way ANOVA, followed by the Tukey multiple comparisons test. P values for post hoc tests are presented as follows: *P < .05, ***P < .001. Significance symbols on the left, middle, and right in each panel indicate the comparison between BEC and 2c hepatocytes, BEC and 4c hepatocytes, and 2c and 4c hepatocytes, respectively. (C) PCA of 2c and 4c hepatocytes with 5 Krt19+Sox9+Gstp1+ BECs using 43 genes. (D) Correlation heatmap for whole genes (43 genes, except Krt7, Afp, and Ncam1, which were expressed in <1% of the analyzed cells) using 5 BECs and 337 hepatocytes. (E) Correlation heatmap of BEC/LPC makers (except Krt19, Gstp1, and Spp1, which were expressed in <1% of hepatocytes) and hepatic marker genes with zone information.
Figure 7
Figure 7
scPCR-based expression profile of hepatocyte and LPC markers in 2c and 4c hepatocytes. (A) Violin plots of nonmonotonically expressed hepatic genes (top), zone 3–enriched genes (middle), zone 1–enriched genes (bottom left), and LPC marker genes (bottom right). Expression level for each gene was normalized with that of Actb. White diamonds indicate mean values. P values were calculated using the Welch t test (n = 92 and 245 for 2c and 4c hepatocytes, respectively). (B) Heatmap with hierarchical clustering of 92 2c and 245 4c hepatocytes using 40 genes. The upper and lower column side color bars, designated as “Cell_Cluster” and “Cell_type”, indicate 12 cell clusters and hepatocyte ploidy, respectively.
Figure 8
Figure 8
Characterization of 2c and 4c hepatocytes by PCA mapping. (A) PCA mapping of 92 2c (green) and 245 4c (blue) hepatocytes. (B–D) Each cell is colored according to the designated gene expression level as scaled with the color key. (B) Solid ellipses and dotted ellipses indicate a Glul-high 2c cell-rich population and zone 3–oriented 4c cell-rich population, respectively. In panels with asterisks, some cells were excluded from the analysis because their inclusion reduced the resolution of the expression profiles for the designated genes. Complete mapping of these genes is shown in panel E. (E) Complete PCA mapping of 337 hepatocytes for Axin2, Cyp1a2, Cyp2c6v1, Gys2, Icam1, and Notch2.
Figure 9
Figure 9
Characterization of LPC-like subpopulation in 2c hepatocytes. (A) Venn diagram describing the co-expression profile of 3 LPC marker genes: Axin2, Prom1, and Lgr5. (B) Cells of Axin2+Prom1+Lgr5+ TP population are highlighted in magenta (upper left). The ploidy status of TP population cells is indicated in green (2c) and blue (4c) (lower left). Expression levels for all of the analyzed LPC marker genes are shown (right). In panels with asterisks, some cells were excluded from the analysis because their inclusion reduced the resolution of the expression profiles for the designated genes. Complete mapping of these genes is shown in Figure 8E. (C) Scatter plot with density estimations for Axin2 vs Prom1 and Prom1 vs Lgr5. Expression levels for each gene are normalized to Actb. (D) Scatter plot with density estimations for Axin2 vs Prom1 and Prom1 vs Lgr5. Expression levels for each gene are normalized to Actb.
Figure 10
Figure 10
Nuclearity-based dissection of 4c hepatocytes. (A) Microscopic identification of the nuclearity of 4c hepatocytes using the C1 microfluidics platform. A total of 106 mononucleated and 69 binucleated hepatocytes were included in this analysis. Images were taken using the BZX-710 microscope (Keyence). (B) PCA for mononucleated and binucleated 4c hepatocytes using 40 genes. (C) Violin plots of nonmonotonically expressed hepatic genes (top), zone 3–enriched genes (middle), zone 1–enriched genes (bottom left), and LPC marker genes (bottom right). P values were calculated using the Welch t test.
Figure 11
Figure 11
Comparison between mononucleated and binucleated 4c hepatocytes and 2c hepatocytes. Violin plots of nonmonotonically expressed hepatic genes (top), zone 3–enriched genes (middle), zone 1–enriched genes (bottom left), and LPC marker genes (bottom right). A total of 92 2c hepatocytes, 106 mononucleated 4c hepatocytes, and 69 binucleated 4c hepatocytes were used. P values at the bottom of each panel were calculated by 1-way ANOVA, followed by the Tukey multiple comparisons test. P values for post hoc tests are presented as follows: *P < .05, **P < .01, ***P < .001. Significance symbols on the left, middle, and right in each panel indicate the comparison between 2c and mononucleated 4c hepatocytes, 2c and binonucleated 4c hepatocytes, and mononucleated and binucleated 4c hepatocytes, respectively.
Figure 12
Figure 12
Analysis of genes that were reported to be expressed differentially among hepatocytes with different ploidy status.P values were calculated by RM 1-way ANOVA using 2c, 4c, and 8c hepatocytes (n = 5 experiments) for 75 probes, which correspond to the 56 differentially expressed genes reported by Lu et al and compared with the P values for whole probes (n = 75 probes for Lu et al; n = 18,021 probes for whole probes).

Comment in

Similar articles

Cited by

References

    1. Gentric G., Celton-Morizur S., Desdouets C. Polyploidy and liver proliferation. Clin Res Hepatol Gastroenterol. 2012;36:29–34. - PubMed
    1. Wang M.J., Chen F., Lau J.T.Y., Hu Y.P. Hepatocyte polyploidization and its association with pathophysiological processes. Cell Death Dis. 2017;8 - PMC - PubMed
    1. Gentric G., Desdouets C. Polyploidization in liver tissue. Am J Pathol. 2014;184:322–331. - PubMed
    1. Pandit S.K., Westendorp B., De Bruin A. Physiological significance of polyploidization in mammalian cells. Trends Cell Biol. 2013;23:556–566. - PubMed
    1. Duncan A.W. Aneuploidy, polyploidy and ploidy reversal in the liver. Semin Cell Dev Biol. 2013;24:347–356. - PubMed

Publication types