. 2019 Dec:238:110564.
doi: 10.1016/j.cbpa.2019.110564. Epub 2019 Sep 4.

Contractile performance of the Alaska blackfish (Dallia pectoralis) ventricle: Assessment of the effects of temperature, pacing frequency, the role of the sarcoplasmic reticulum in contraction and adrenergic stimulation

Affiliations

Contractile performance of the Alaska blackfish (Dallia pectoralis) ventricle: Assessment of the effects of temperature, pacing frequency, the role of the sarcoplasmic reticulum in contraction and adrenergic stimulation

Kerry L Kubly et al. Comp Biochem Physiol A Mol Integr Physiol. 2019 Dec.

Abstract

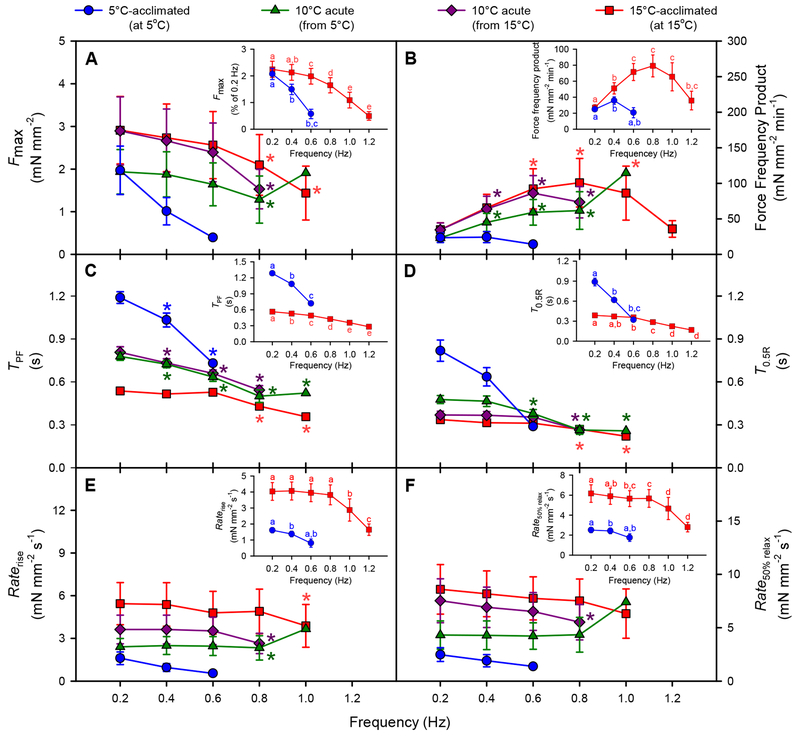
The air-breathing Alaska blackfish (Dallia pectoralis) experiences aquatic hypoxia, but restricted air-access in winter due to ice-cover. To lend insight into its overwintering strategy, we examined the effects of thermal acclimation (15 °C vs. 5 °C), acute temperature change (to 10 °C), increased pacing frequency, inhibition of sarcoplasmic reticulum (SR) Ca2+ release and uptake and adrenaline (1000 nmol l-1) on the contractile performance of isometrically-contracting, electrically-paced ventricular strips. At routine pacing frequencies, maximal developed force (Fmax) was equivalent at 5 °C (2.1 ± 0.2 mN mm-2) and 15 °C (2.2 ± 0.3 mN mm-2), whereas contraction durations were 2.2- to 2.4-times longer and contraction rates 2.4- to 3.5-times slower at 5 °C. Maximum contraction frequency was reduced by decreased temperature, being 0.91 ± 0.04 Hz at 15 °C, 0.35 ± 0.02 Hz at 5 °C and equivalent between acclimation groups at 10 °C (~0.8 Hz). 15 °C and 5 °C strips were insensitive to SR inhibition at routine stimulation frequencies, but SR function supported high contraction rates at 10 °C and 15 °C. Adrenaline shortened T0.5R and increased relaxation rate by 18-40% at 15 °C, whereas at 5 °C, adrenaline augmented Fmax by 15-25%, in addition to increasing contraction kinetics by 22-82% and decreasing contraction duration by 20%. Overall, the results reveal that ventricular contractility is suppressed in cold-acclimated Alaska blackfish largely by acute and perhaps direct effects of decreased temperature, which effectively preconditions the tissue for low energy supply during winter hypoxia. Additionally, the level of cardiac performance associated with maintained activity in winter is supported by enhanced inotropic responsiveness to adrenaline at 5 °C.

Keywords: Adrenaline; Cardiac; Force-frequency; Heart; Ryanodine; Sarcoplasmic reticulum; Temperature; Thapsigargin.


Conflict of interest statement

Conflict of Interest

The authors declare no competing interests.

Figures

Fig. 1.
Fig. 1.
Experimental treatment groups and protocol. After determination of the length at which active tension was maximal (Lmax), strips were allowed a 20 min equilibration period at acclimation temperature with tonic adrenergic stimulation (10 nmol l−1). Baseline contractile properties at routine stimulation frequencies (0.3 Hz at 15°C; 0.2 Hz at 15°C) were determined at t=0 h, Bath saline was refreshed immediately prior to each of the three temperature exposure conditions (diamonds) and pharmaceutical agents for each treatment group were applied as indicated. Following saline refresh, all strips received a tonic level of adrenaline (10 nmol l−1; adr), and ryanodine (10 μmol l−1) and thapsigargin (2 μmol l−1) were applied to the SR-Blocked and SR-Blocked + High Adrenaline treatment groups. A physiologically relevant maximal dose of adrenaline (1000 nmol l−1; ADR) was applied to the SR-Blocked + High Adrenaline and High Adrenaline treatment groups 20 min after bath temperature stabilized following the saline refresh. Force-frequency trials (f-f) were conducted at Baseline and at the conclusion of each exposure condition.
Fig. 2.
Fig. 2.
Comparison of maximal developed force (Fmax; A), duration of contraction (TDC; B), time-to-peak force (TPF; C), time-to-half relaxation (T0.5R; D), rate of contraction (Raterise; E) and rate of 50% relaxation (Rate50% relax; F) at Baseline of 15°C- and 5°C-acclimated isometrically-contracting Alaska blackfish ventricular strips paced at routine stimulation frequencies (0.3 Hz at 15°C; 0.2 Hz at 5°C). Means ± S.E.M. calculated from Untreated strips are presented in the main panels. Means ± S.E.M. calculated from all strips at each acclimation temperature are presented in the insets. For each contractile parameter, dissimilar letters indicate a statistically significant difference (P<0.05; unpaired t-tests) between 15°C and 5°C, a dagger (†) indicates statistically significant differences (P<0.05; unpaired t-tests) between 15°C and 5°C strips measured at 10°C and asterisks indicate a statistically significant change (P<0.05; paired t-tests) with acute exposure to 10°C from acclimation temperature. N values are presented in Fig. 4.
Fig. 3.
Fig. 3.
Comparison of the effects of increased stimulation frequency at Baseline on maximal developed force (Fmax; A), force frequency product (B), time-to-peak force (TPF; C), time-to-half relaxation (T0.5R; D), rate of contraction (Raterise; E) and rate of 50% relaxation (Rate50% relax; F) of 15°C- and 5°C-acclimated isometrically-contracting Alaska blackfish ventricular strips. Means ± S.E.M. calculated from Untreated strips are presented in the main panels. Means ± S.E.M. calculated from all strips at each acclimation temperature are presented in the insets. For each contractile parameter and measurement temperature, asterisks (main panels) indicate statistically significant differences (P<0.05; 1-way RM ANOVA, Student-Newman-Keuls post hoc test) from 0.2 Hz, and dissimilar letters (insets) indicate statistically significant differences among frequencies (P<0.05; 1-way RM ANOVA, Student-Newman-Keuls post hoc test). N values are presented in Fig. 4.
Fig. 4.
Fig. 4.
N values (= number of strips) for each experimental treatment group and the maximum contraction frequency of individual strips at each exposure condition. Mean (± S.E.M.) maximum contraction frequencies are presented below the individual data. For each acclimation temperature, dissimilar uppercase letters indicate statistically significant differences (P<0.05) between treatment groups within an exposure condition and dissimilar lowercase letters indicate statistically significant differences (P<0.05) between exposure conditions within a treatment group as determined with a 2-way RM ANOVA and Student-Newman-Keuls post hoc test.
Fig. 5.
Fig. 5.
Comparison of the effects of experimental treatment and exposure condition on maximal developed force (Fmax; A), duration of contraction (TDC; B), time-to-peak force (TPF; C), time-to-half relaxation (T0.5R; D), rate of contraction (Raterise; E) and rate of 50% relaxation (Rate50% relax; F) of 15°C-acclimated isometrically-contracting Alaska blackfish ventricular strips paced at 0.3 Hz. Data are normalized to Baseline for each contractile parameter and treatment group. Dissimilar uppercase letters indicate statistically significant differences (P<0.05) between treatment groups within an exposure condition and a treatment group abbreviation (detailed in panel A) above a data point indicates a statistically significantly difference (P<0.05) from Baseline for that treatment group as determined with a 2-way RM ANOVA and Student-Newman-Keuls post hoc test using log10 transformed data. N values are presented in Fig. 4.
Fig. 6.
Fig. 6.
Comparison of the effects of experimental treatment and exposure condition on maximal developed force (Fmax; A), duration of contraction (TDC; B), time-to-peak force (TPF; C), time-to-half relaxation (T0.5R; D), rate of contraction (Raterise; E) and rate of 50% relaxation (Rate50% relax; F) of 5°C-acclimated isometrically-contracting Alaska blackfish ventricular strips paced at 0.2 Hz. Data are normalized to Baseline for each contractile parameter and treatment group. Dissimilar uppercase letters indicate statistically significant differences (P<0.05) between treatment groups within an exposure condition and a treatment group abbreviation (detailed in panel A) above a data point indicates a statistically significantly difference (P<0.05) from Baseline for that treatment group as determined with a 2-way RM ANOVA and Student-Newman-Keuls post hoc test using log10 transformed data. N values are presented in Fig. 4.
Fig. 7.
Fig. 7.
Comparison of the effects of experimental treatment and exposure condition on maximal developed force (Fmax; A), force frequency product (B), time-to-peak force (TPF; C), time-to-half relaxation (T0.5R; D), rate of contraction (Raterise; E) and rate of 50% relaxation (Rate50% relax; F) of 15°C-acclimated isometrically-contracting Alaska blackfish ventricular strips during force-frequency trials. Due to decreasing N with increasing pacing frequency, comparisons among treatment groups and exposure condition were conducted using values averaged over the physiologically relevant frequency range, as detailed in section 2.6 Statistical analysis and depicted in Fig. S2. Data are normalized to Baseline for each contractile parameter and treatment group. Dissimilar uppercase letters indicate statistically significant differences (P<0.05) between treatment groups within an exposure condition and a treatment group abbreviation (detailed in panel A) above a data point indicates a statistically significantly difference (P<0.05) from Baseline for that treatment group as determined with a 2-way RM ANOVA and Student-Newman-Keuls post hoc test using log10 transformed data. N values are presented in Fig. 4.
Fig. 8.
Fig. 8.
Comparison of the effects of experimental treatment and exposure condition on maximal developed force (Fmax; A), force frequency product (B), time-to-peak force (TPF; C), time-to-half relaxation (T0.5R; D), rate of contraction (Raterise; E) and rate of 50% relaxation (Rate50% relax; F) of 5°C-acclimated isometrically-contracting Alaska blackfish ventricular strips during force-frequency trials. Due to decreasing N with increasing pacing frequency, comparisons among treatment groups and exposure condition were conducted using values averaged over the physiologically relevant frequency range, as detailed in section 2.6 Statistical analysis and depicted in Fig. S3. Data are normalized to Baseline for each contractile parameter and treatment group. Dissimilar uppercase letters indicate statistically significant differences (P<0.05) between treatment groups within an exposure condition and a treatment group abbreviation (detailed in panel A) above a data point indicates a statistically significantly difference (P<0.05) from Baseline for that treatment group as determined with a 2-way RM ANOVA and Student-Newman-Keuls post hoc test using log10 transformed data. N values are presented in Fig. 4.

Similar articles

Cited by

References

    1. Abramochkin DV, Vornanen M, 2015. Seasonal acclimatization of the cardiac potassium currents (IK1 and IKr) in an arctic marine teleost, the navaga cod (Eleginus navaga). J. Comp. Physiol. B 185, 883–890. - PubMed
    1. Aho E, Vornanen M, 1999. Contractile properties of atrial and ventricular myocardium of the heart of rainbow trout Oncorhynchus mykiss: Effects of thermal acclimation. J. Exp. Biol 202, 2663–2677. - PubMed
    1. Aho E, Vornanen M, 2001. Cold acclimation increases basal heart rate but decreases its thermal tolerance in rainbow trout (Oncorhynchus mykiss). J. Comp. Phyisol. B 171, 173–179. - PubMed
    1. Birkedal R, Shiels HA, 2007. High [Na+]i in cardiomyocytes from rainbow trout. Am. J. Phys. Regul. Integr. Comp. Phys 293, R861–R866. - PubMed
    1. Campbell MA, Lopéz JA, 2014. Mitochondrial phylogeography of a Beringian relict: the endemic freshwater genus of blackfish Dallia (Esociformes). J. Fish Biol. 84, 523–538. - PubMed

Publication types

MeSH terms

Substances