. 2019:154:85-107.
doi: 10.1016/bs.mcb.2019.04.013. Epub 2019 May 17.

Novel fluorescence techniques to quantitate renal cell biology

Affiliations

Novel fluorescence techniques to quantitate renal cell biology

Urvi Nikhil Shroff et al. Methods Cell Biol. 2019.

Abstract

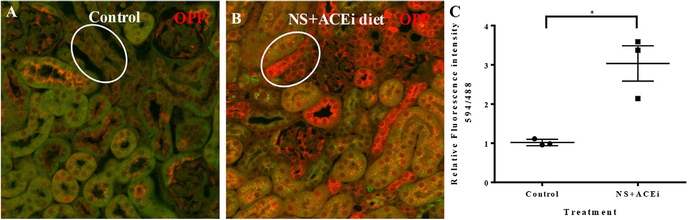
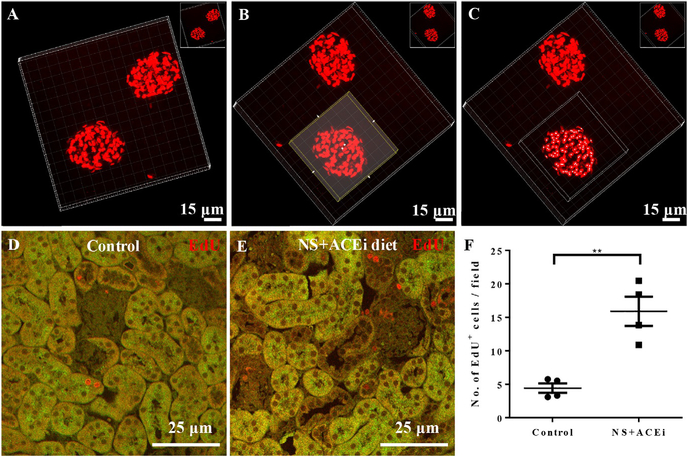
Fluorescence microscopy techniques are powerful tools to study tissue dynamics, cellular function and biology both in vivo and in vitro. These tools allow for functional assessment and quantification along with qualitative analysis, thus providing a comprehensive understanding of various cellular processes under normal physiological and disease conditions. The main focus of this chapter is the recently developed method of serial intravital multiphoton microscopy that has helped shed light on the dynamic alterations of the spatial distribution and fate of single renal cells or cell populations and their migration patterns in the same tissue region over several days in response to various stimuli within the living kidney. This technique is very useful for studying in vivo the molecular and cellular mechanisms of tissue remodeling and repair after injury. In addition, complementary in vitro imaging tools are also described and discussed, like tissue clearing techniques and protein synthesis measurement in tissues in situ that provide an in depth assessment of changes at the cellular level. Thus, these novel fluorescence techniques can be effectively leveraged for different tissue types, experimental conditions as well as disease models to improve our understanding of renal cell biology.

Keywords: Fluorescent reporter; Intravital imaging; Multiphoton microscopy; Podocyte; Protein synthesis; Tissue remodeling.


Figures

FIG. 1
FIG. 1
AIW implantation for serial intravital MPM. (A, B) Representative images of AIW used for serial MPM highlighting the customized titanium ring with the fitted coverslip (A) and the groove (B). (C) Representative image of a C57BL6 mouse after surgical implantation of AIW on the left kidney. (D) Tile scan image map of the entire available kidney surface of a Pod-Confetti mouse as visualized via the AIW. Tile scan image consisting of 15 × 15 individual full xy frames (using a 40 × water immersion objective) was generated by the tile scan function of Leica LAS X software and by using a motorized stage. A two-channel preview (one GFP/YFP and one RFP) of the four confetti channels is shown. Region of interests (ROIs) are highlighted by circles and are annotated for easy identification of different glomeruli.
FIG. 2
FIG. 2
Schematic illustration of single cell migration and fate tracking using various applications of serial MPM. Genetic identification and fate tracking of different single renal cells or cell populations including podocytes and renin-lineage cells is made possible using unique multi-color fluorescent tags (e.g., using Confetti construct consisting of membrane-targeted CFP (blue), nuclear-targeted GFP (green), cytosolic YFP (yellow) or RFP (red)) expressed by the cells in lineage-specific transgenic mouse models. Intravital imaging of the same area and tissue volume of the glomerulus over time allows the tracking of alterations in cell distribution and migration patterns (illustrated by arrows), and the dynamics of tissue turnover in response to injury or stress. Serial MPM-based cell fate tracking can also be complemented by functional assessment of hemodynamics, filtration rates and albuminuria. Serial MPM is a powerful tool to visualize and quantitate alterations in the renal tissue at a single cell and nephron level, thus overcoming limitations of tissue heterogeneity.
FIG. 3
FIG. 3
Representative serial MPM images of single cell fate tracking using fluorescent reporter mouse models. (A) Representative single projection image of multiple optical sections (z-stack, Supplementary Video 1 in the online version at https://doi.org/10.1016/bs.mcb.2019.04.013) of a Pod-Confetti mouse glomerulus. Single podocytes can be identified based on their unique Confetti color (either blue/green/yellow/red). (B,C) Representative images of the same glomeruli (G1–G3) of a Pod-Confetti mouse visualized by serial MPM after AIW implantation (B) and 6 days later (C). The same blue (CFP+), green (GFP+), yellow (YFP+), and red (RFP+) podocytes can be re-identified in consecutive imaging sessions (arrows). (D) Representative single projection image of multiple optical sections (z-stack, Supplementary Video 2 in the online version at https://doi.org/10.1016/bs.mcb.2019.04.013) of a Ren1d-Confetti mouse glomerulus. (E,F) Representative images of the same glomeruli (G1–G2) of a Ren1d-Confetti mouse visualized by serial MPM after AIW implantation (E) and 5 days later (F). Changes in the relative position of the same blue (CFP+), yellow (YFP+), and red (RFP+) parietal epithelial cells can be tracked in consecutive imaging sessions (arrows). Plasma was labeled with iv injected Alexa680-BSA converted to grayscale in the images. Bars are 25 μm.
FIG. 4
FIG. 4
Demonstration of cell calcium measurements with serial MPM in podocytes in vivo and their changes in response to injury. (A, B) Representative MPM images of the same xy plane in the same kidney of a Pod-GCaMP5/Tomato mouse receiving l-NAME (1 g/L in drinking water ad libitum) at baseline (A) and 14 days after single Adriamycin (ADR 12 mg/kg body weight iv) injection (B). Arrows highlight podocytes in which GCaMP5 fluorescence intensity (green/yellow) increased between time points compared to the steady levels of Tomato (red), reflecting elevations in cell calcium. (C) Scatter plot summary of changes in podocyte intracellular calcium at baseline and 14 days after ADR injection. Each data point represents a ratio of the GCaMP5 (G5) to Tomato (T) intensity of a single podocyte. Data represents mean ± SEM. l-NAME group: n = 3; l-NAME + ADR group: n = 4, >10 podocytes/animal, unpaired t-test, ns: not significant, ****P<0.0001.
FIG. 5
FIG. 5
Fluorescence-based quantification of overall rate of single cell protein synthesis in the kidney in situ. (A, B) Representative fluorescence images of kidney tissue of C57BL6 mice treated with control diet (A) and salt deficient (NS) diet with angiotensin converting enzyme inhibitor (ACEi) (B) after OPP injection (20 mM OPP ip for 1 h). Patterns of protein synthesis are visualized in red. ROIs highlighted in circles demonstrate collecting duct segments. (C) Scatter plot summary of OPP relative fluorescence intensity as a measure of protein synthesis. Relative fluorescence intensity is calculated as a ratio of red (594/615 nm excitation/emission) to green (488/519 nm excitation/emission) fluorescence intensity in each ROI using Leica LAS X software. Data represents mean ± SEM (n = 3 each, 10 fields/animal, 5 ROIs/field, unpaired t-test, *P = 0.0113).
FIG. 6
FIG. 6
Cell-specific marker based quantification using fluorescence techniques. (A–C) Stepwise depiction of cell-specific marker based quantification using IMARIS software (WT1 for podocytes). After rendering the multiple optical scans (z-stacks) in 3D in IMARIS (A), a 3D ROI was defined (B). “Spots” tool was used to obtain a count of the total number of WT1+ cells within the ROI. Each white spot represents a single nucleus (C). (D, E) Representative fluorescence images of kidney tissue of C57BL6 mice treated with control diet (D) and NS +ACEi diet (E) after five consecutive EdU injections (100 μL of 1 mg/mL ip every day). EdU+ nuclei appear in red. (F) Scatter plot summary of total number of EdU+ cells/field. Data represents mean ± SEM (n = 4, 10 fields/animal, unpaired t-test, **P = 0.0024).

Similar articles

Cited by

References

    1. Basile DP, Friedrich JL, Spahic J, Knipe N, Mang H, Leonard EC, et al. (2011). Impaired endothelial proliferation and mesenchymal transition contribute to vascular rarefaction following acute kidney injury. American Journal of Physiology. Renal Physiology, 300(3), F721–F733. 10.1152/ajprenal.00546.2010. - DOI - PMC - PubMed
    1. Brahler S, Yu H, Suleiman H, Krishnan GM, Saunders BT, Kopp JB, et al. (2016). Intravital and kidney slice imaging of podocyte membrane dynamics. Journal of the American Society of Nephrology, 27(11), 3285–3290. 10.1681/asn.2015121303. - DOI - PMC - PubMed
    1. Brahler S, Zinselmeyer BH, Raju S, Nitschke M, Suleiman H, Saunders BT, et al. (2018). Opposing roles of dendritic cell subsets in experimental GN. Journal of the American Society of Nephrology, 29(1), 138–154. 10.1681/asn.2017030270. - DOI - PMC - PubMed
    1. Buckley C, Carvalho MT, Young LK, Rider SA, McFadden C, Berlage C, et al. (2017). Precise spatio-temporal control of rapid optogenetic cell ablation with mem-KillerRed in zebrafish. Scientific Reports, 7(1), 5096 10.1038/s41598-017-05028-2. - DOI - PMC - PubMed
    1. Burford JL, Villanueva K, Lam L, Riquier-Brison A, Hackl MJ, Pippin J, et al. (2014). Intravital imaging of podocyte calcium in glomerular injury and disease. The Journal of Clinical Investigation, 124(5), 2050–2058. 10.1172/JCI71702. - DOI - PMC - PubMed

Publication types

MeSH terms

LinkOut - more resources