. 2019 Nov 7;76(3):473-484.e7.
doi: 10.1016/j.molcel.2019.07.038. Epub 2019 Sep 4.

Decreased Enhancer-Promoter Proximity Accompanying Enhancer Activation

Affiliations

Decreased Enhancer-Promoter Proximity Accompanying Enhancer Activation

Nezha S Benabdallah et al. Mol Cell. .

Abstract

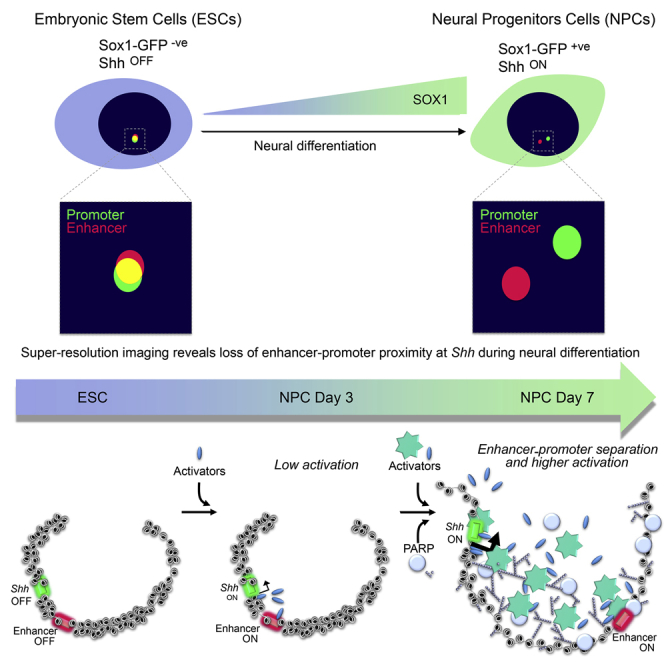
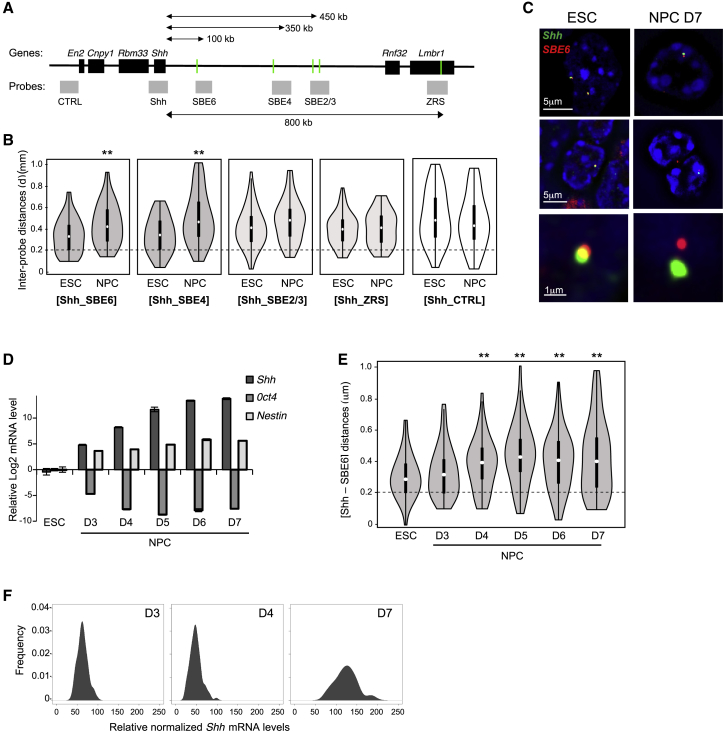
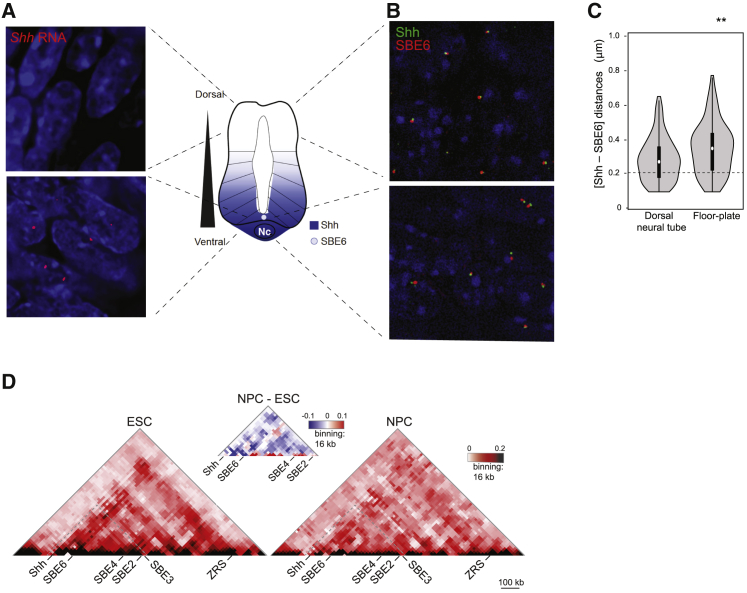
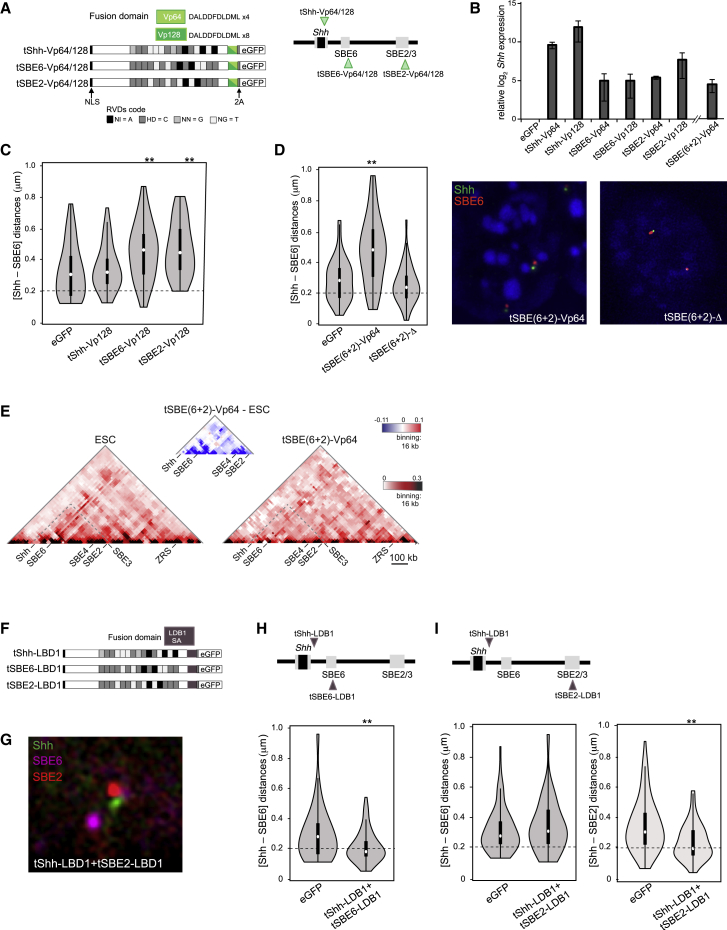
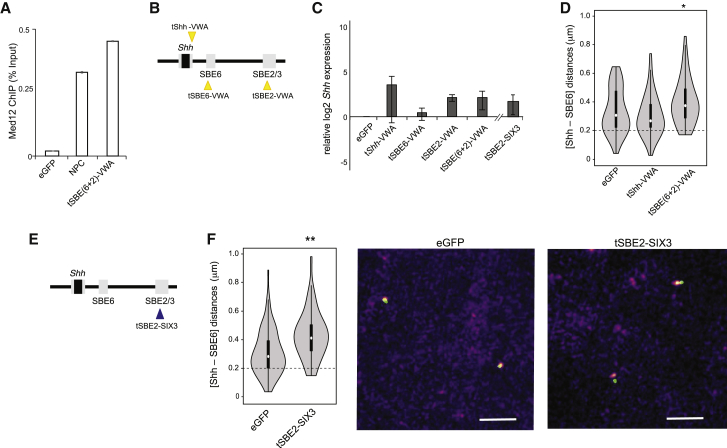
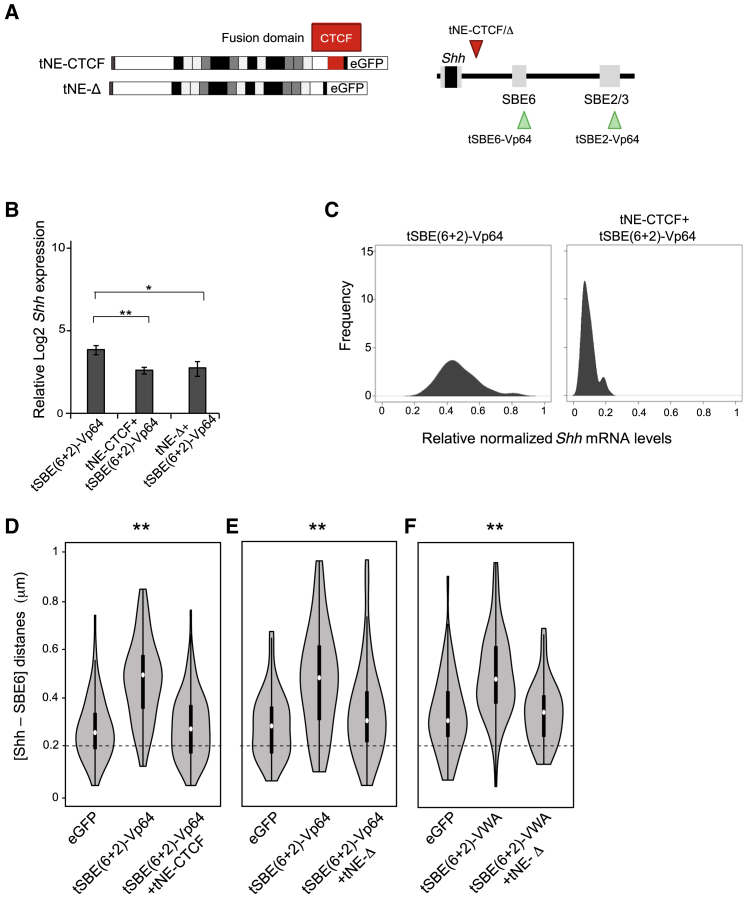
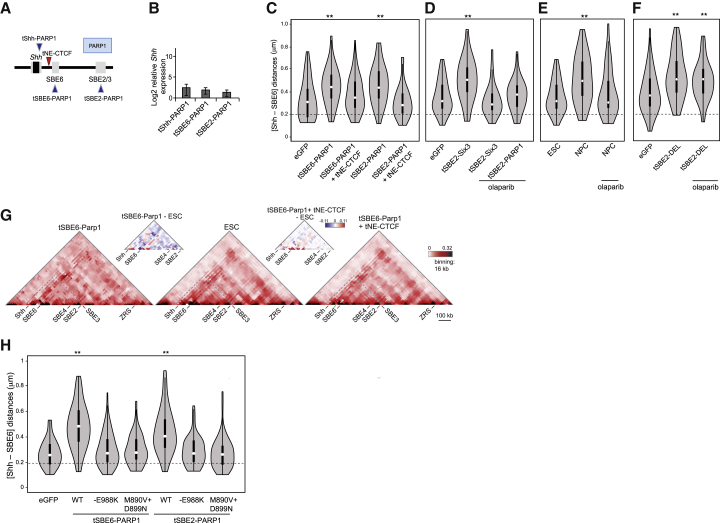
Enhancers can regulate the promoters of their target genes over very large genomic distances. It is widely assumed that mechanisms of enhancer action involve the reorganization of three-dimensional chromatin architecture, but this is poorly understood. The predominant model involves physical enhancer-promoter interaction by looping out the intervening chromatin. However, studying the enhancer-driven activation of the Sonic hedgehog gene (Shh), we have identified a change in chromosome conformation that is incompatible with this simple looping model. Using super-resolution 3D-FISH and chromosome conformation capture, we observe a decreased spatial proximity between Shh and its enhancers during the differentiation of embryonic stem cells to neural progenitors. We show that this can be recapitulated by synthetic enhancer activation, is impeded by chromatin-bound proteins located between the enhancer and the promoter, and appears to involve the catalytic activity of poly (ADP-ribose) polymerase. Our data suggest that models of enhancer-promoter communication need to encompass chromatin conformations other than looping.

Keywords: PARP; Sonic hedgehog; TAL-effector; chromatin looping; enhancer; poly(ADP-ribosyl)ation.


Conflict of interest statement

The authors declare no competing interests.

Figures

None
Graphical abstract
Figure 1
Figure 1
Loss of Shh-Brain-Enhancer Proximity during Neuronal Differentiation (A) Map of the Shh regulatory domain showing the genes (black boxes), enhancers (green bars), and fosmid FISH probes (gray boxes). Probe and enhancer coordinates are listed in Table S8. (B) Violin plots showing the distribution of inter-probe distances (μm) between Shh and SBE6, SBE4, SBE2/3, ZRS, and CTRL probes in the nuclei of ESCs and D7 NPCs. Distances below the dotted horizontal line at 0.2 μm are considered co-localized. The asterisks on the FISH data represent Mann-Whitney U test significance between ESC and NPC populations. ∗∗p < 0.01. Each violin plot represents one biological replicate; for other replicates and statistics, see Figure S1 and Table S1. (C) 3D-SIM images illustrating Shh-SBE6 separation in ESCs or in D7 NPCs. Scales bars are 5 μm (top two rows) and 1 μm (bottom, inset from center row). (D) Shh, Oct4, and Nestin expression assayed by qRT-PCR during a time course of NPC differentiation. The graph shows mean (±SEM) log2 mRNA levels relative to Gapdh and normalized to the level in ESC (three technical replicates). (E) Violin plots showing Shh-SBE6 inter-probe distances in cell populations corresponding to the expression data in (D). (F) Kernel density plots showing Shh mRNA expression in single NPCs relative to Gapdh and normalized to the expression in ESC. Density is an arbitrary unit based on the frequency of the occurrence and the total counts and the size of the population (i.e., the binning of the data). Data from a biological replicate are shown in Figure S1B.
Figure 2
Figure 2
Enhancer-Promoter Separation Occurs In Vivo (A) Schematic of a transverse section through the neural tube with a gradient of Shh emanating from ventral Shh-expressing cells in the notochord (Nc) and the floor plate, where SBE6 activity is also detected (Benabdallah et al., 2016). Panels at left show RNA FISH signal (red) for Shh in sections from the dorsal neural tube (top panel) or the floor plate (bottom panel) of E10.5 mouse embryos. (B) 3D-FISH SIM images illustrating Shh-SBE6 separation in nuclei from the dorsal neural tube (top) or ventral floor plate (bottom) of E10.5 mouse embryos. (C) Violin plots showing Shh-SBE6 inter-probe distances for FISH data from E10.5 dorsal neural tube and ventral floor plate cells. ∗∗p < 0.01 for this biological replicate. For two other biological replicates, p = 0.002 and p < 0.001. (D) 5C heatmaps of the Shh regulatory region (mm9, chr5:28604000-29780000) from ESCs and D7 NPCs with 16 kb binning and smoothing. A difference plot for the 5C heatmaps between NPCs and ESCs is shown above. Data from a biological replicate are shown in Figure S2C.
Figure 3
Figure 3
Synthetic Activation of Shh and Increased Enhancer-Promoter Separation Using TALE-VP16 (A) Schematic of TALE-VP64 and TALE-VP128 constructs targeting the Shh promoter (tShh), SBE6, or SBE2. Repeat variable diresidue (RVD) code is displayed with one-letter abbreviations for amino acids. Self-cleaving (2A) peptide allows the expression of eGFP and cell isolation by fluorescence-activated cell sorting (FACS). A map of the targeting sites is shown at right. (B) Log2 mRNA levels of Shh, relative to Gapdh, assayed by qRT-PCR after TALE-VP64/128 expression in ESCs. Data show means (±SEMs) of three biological replicates normalized to ESCs expressing a control eGFP. (C) Violin plots representing one biological replicate of Shh-SBE6 inter-probe distances (μm) in ESCs expressing control eGFP, TALE-VP128 fusions targeting Shh promoter (tShh), SBE6, or SBE2. ∗∗p < 0.01. Statistical data and replicate experiments are in Table S2. Distances below the dotted horizontal line at 0.2 μm are considered co-localized. (D) As in (C), but for VP64 recruitment to both SBE6 and SBE2 simultaneously (tSBE6+2), or a TALE with no fusion protein (tSBE6+2)-Δ. ∗∗p < 0.01. Representative FISH images with probes for Shh (green) and SBE6 (red) in mESCs expressing tSBE(6+2)-VP64 and tSBE(6+2)-Δ are shown at right. (E) 5C heatmaps of the Shh regulatory region (chr5:28604000-29780000) with 16 kb binning and smoothing for ESCs and for ESCs expressing TALE-VP64 fusions targeting both SBE6 and SBE2. Difference 5C plots are shown above the main 5C plots. (F) Schematic representing TALE-LDB1 targeting sequences. (G) Three-color FISH with probes for Shh (green), SBE6 (magenta), and SBE2 (red) in mESCs expressing tShh-LDB1+tSBE2-LDB1. (H) Violin plots displaying Shh and SBE6 inter-probe distances (μm) in ESCs expressing eGFP or tShh-LDB1+tSBE6-LDB1. ∗∗p < 0.01. (I) As in (H), but in cells expressing tShh-LDB1+tSBE2-LDB1. Shh-SBE6 distances are shown in the left-hand panel, and Shh-SBE2 distances are in the right-hand panel. ∗∗p < 0.01. Statistical data relating to this figure are included in Table S3.
Figure 4
Figure 4
Enhancer-Promoter Separation Induced by Endogenous Activators and Co-activators (A) Med12 ChIP (percentage of input, normalized to β-actin promoter) at Shh promoter measured by qPCR in NPC or in ESCs expressing eGFP or tSBE(6+2)-vWA. (B) Schematic showing the targeting of TALE-vWA constructs. (C) Log2 mRNA levels of Shh relative to Gapdh in ESCs expressing TALE-vWA constructs targeting the Shh promoter (tShh), SBE6, SBE2, or both SBE6 and SBE2. Data for a TALE targeting SIX3 to SBE2 are also shown. Data show means (±SEMs) of three biological replicates normalized to ESCs expressing eGFP. (D) Violin plots of Shh-SBE6 inter-probe distances (μm) in cells expressing eGFP or TALE-vWA targeting the Shh promoter (tShh), or both SBE6 and SBE2. p = 0.018. Statistical data and replicate experiments are shown in Table S4. (E) Schematic showing the targeting of TALE-SIX3 construct to SBE2. (F) As in (D), but for ESCs expressing tSBE2-SIX3. ∗∗p < 0.01. Example FISH images are shown at right. Bar, 2 μm.
Figure 5
Figure 5
Enhancer-Promoter Spatial Separation Is Blocked by Intervening Chromatin-Bound Proteins (A) Schematic showing TALEs targeting the NE site with either no fusion protein (tNE-Δ) or fused to CTCF (tNE-CTCF). (B) Log2 mean (±SEM) Shh mRNA levels relative to Gapdh in ESCs expressing TALE-VP64 fusions targeting SBE6 and SBE2 and in cells that also express either tNE-CTCF (three biological replicates) or tNE-Δ (four biological replicates). Data are normalized to those from ESCs expressing control eGFP. The asterisks represent p values for a one-tailed Student’s t test between conditions. p < 0.05 and ∗∗p < 0.01. (C) Kernel density plots showing Shh expression in single ESCs expressing TALE-VP64 fusions targeting SBE6+SBE2 and in these cells when tNE-CTCF is also expressed. Expression is normalized to that in ESCs. (D and E) Violin plots representing one biological replicate of Shh-SBE6 inter-probe distances (μm) in ESCs expressing eGFP, TALE-VP64 fusions targeting SBE6+SBE2, and these cells when either tNE-CTCF (D) or tNE-Δ (E) is also expressed. (F) As in (E), but using a TALE-vWA fusion targeting SBE6 and SBE2. p < 0.05 and ∗∗p < 0.01. Statistical data for FISH data from this figure are shown in Table S5.
Figure 6
Figure 6
PARP1 Catalytic Activity Decreases Enhancer-Promoter Proximity (A) Schematic of TALEs that target PARP1 to the Shh promoter (tShh), SBE6, or SBE2. (B) Log2 mRNA levels of Shh relative to Gapdh in ESCs expressing the TALE-PARP1 constructs shown in (A). Data show means (±SEMs) of five biological replicates normalized to ESCs expressing eGFP. (C) Violin plots representing one biological replicate of Shh-SBE6 inter-probe distances (μm) in ESCs expressing eGFP, tSBE6-PARP1, tSBE6-PARP1+tNE-CTCF, tSBE2-PARP1, and tSBE2-PARP1+tNE-CTCF.∗∗p < 0.01. (D) As in (C) but for ESCs expressing eGFP and tSBE2-Six3, and then in tSBE2-Six3 or tSBE2-PARP1-expressing cells treated with olaparib. (E) Violin plots representing one biological replicate of Shh-SBE6 inter-probe distances in ESCs or NPCs and in NPCs treated with olaparib. (F) As in (D), but for ESCs expressing eGFP or tShh-DEL with and without olaparib treatment. ∗∗p < 0.01. Statistical data and replicate experiments are shown in Table S6. (G) 5C heatmaps of the Shh regulatory region (chr5:28604000-29780000) with 16 kb binning and smoothing for ESCs and for ESCs expressing TALE-PARP1 fusions targeting SBE6 or ESCs co-expressing tSBE6-PARP1 and TALE-CTCF targeting NE. Difference 5C plots are shown above the main 5C plots. Data for a replicate experiment are shown in Figure S5. (H) Violin plots representing one biological replicate of Shh-SBE6 inter-probe distances (μm) in ESCs expressing tSBE6-PARP1 or tSBE2-PARP1, PARP1 catalytic mutant E988K, or PARP1 catalytic double mutant M890V+D899N. ∗∗p < 0.01. Statistical data relating to FISH data are shown in Table S7.

Similar articles

Cited by

References

    1. Alexander J.M., Guan J., Li B., Maliskova L., Song M., Shen Y., Huang B., Lomvardas S., Weiner O.D. Live-cell imaging reveals enhancer-dependent Sox2 transcription in the absence of enhancer proximity. eLife. 2019;8:e41769. - PMC - PubMed
    1. Ali T., Renkawitz R., Bartkuhn M. Insulators and domains of gene expression. Curr. Opin. Genet. Dev. 2016;37:17–26. - PubMed
    1. Altmeyer M., Neelsen K.J., Teloni F., Pozdnyakova I., Pellegrino S., Grøfte M., Rask M.D., Streicher W., Jungmichel S., Nielsen M.L., Lukas J. Liquid demixing of intrinsically disordered proteins is seeded by poly(ADP-ribose) Nat. Commun. 2015;6:8088. - PMC - PubMed
    1. Anderson E., Hill R.E. Long range regulation of the sonic hedgehog gene. Curr. Opin. Genet. Dev. 2014;27:54–59. - PubMed
    1. Bartman C.R., Hsu S.C., Hsiung C.C.-S., Raj A., Blobel G.A. Enhancer Regulation of Transcriptional Bursting Parameters Revealed by Forced Chromatin Looping. Mol. Cell. 2016;62:237–247. - PMC - PubMed

Publication types

MeSH terms