. 2019 Sep 25;9(3):229-242.e4.
doi: 10.1016/j.cels.2019.06.008. Epub 2019 Sep 4.

Microbial Interaction Network Inference in Microfluidic Droplets

Affiliations

Microbial Interaction Network Inference in Microfluidic Droplets

Ryan H Hsu et al. Cell Syst. .

Abstract

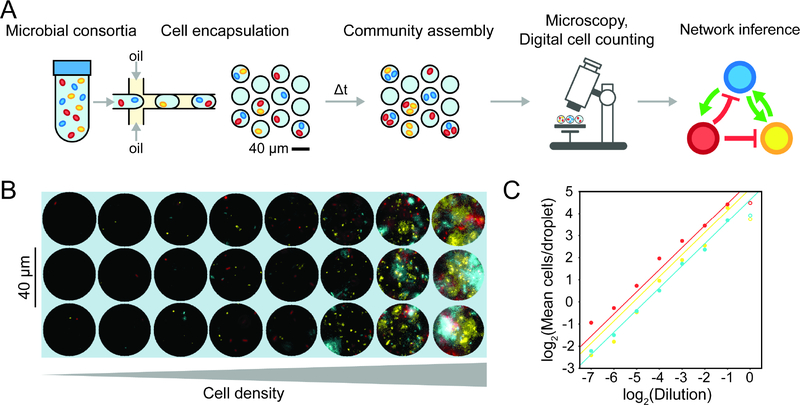
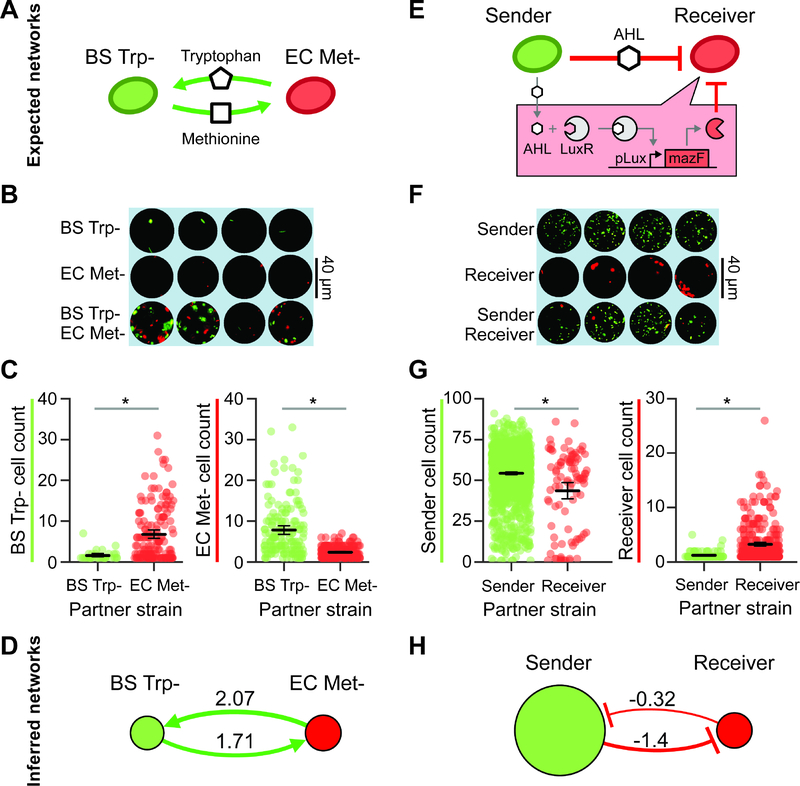
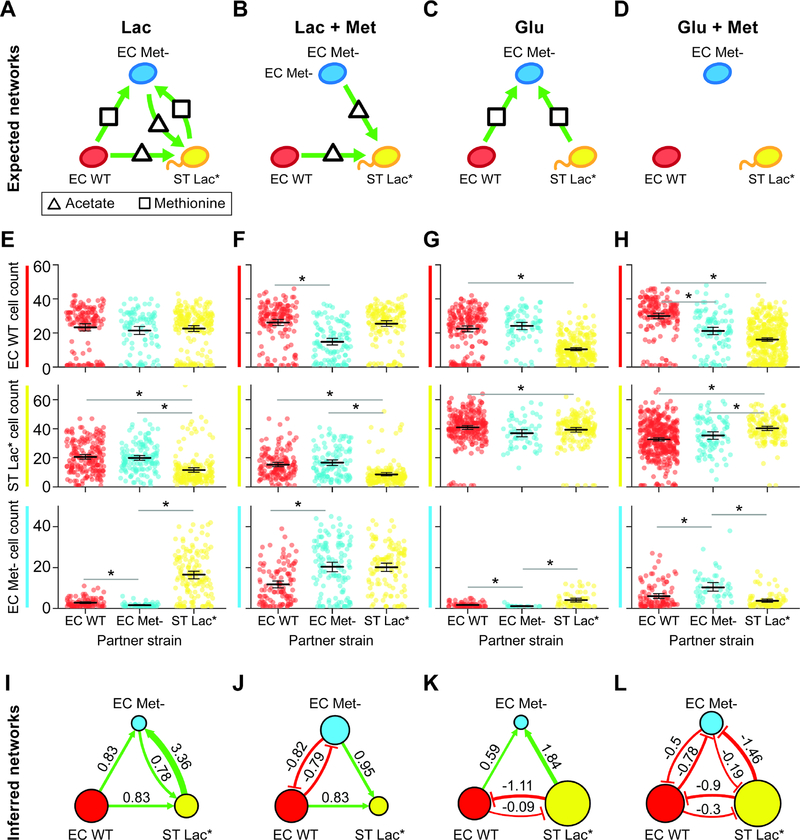
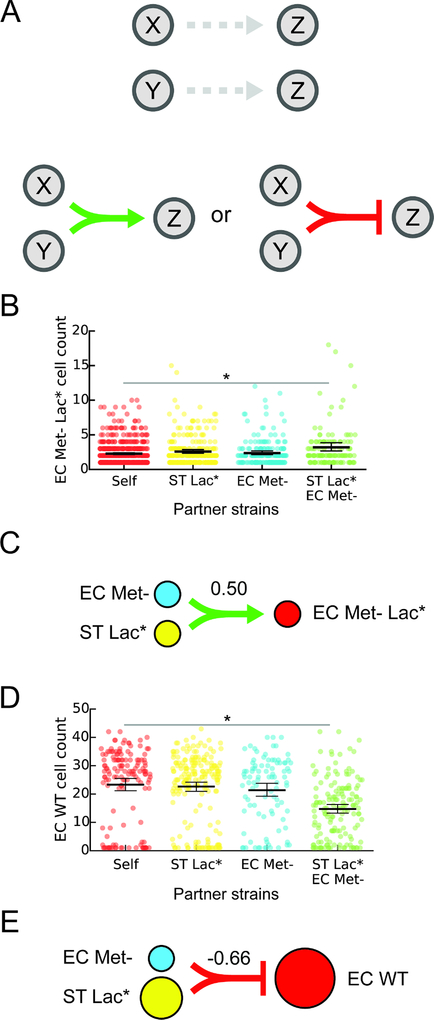
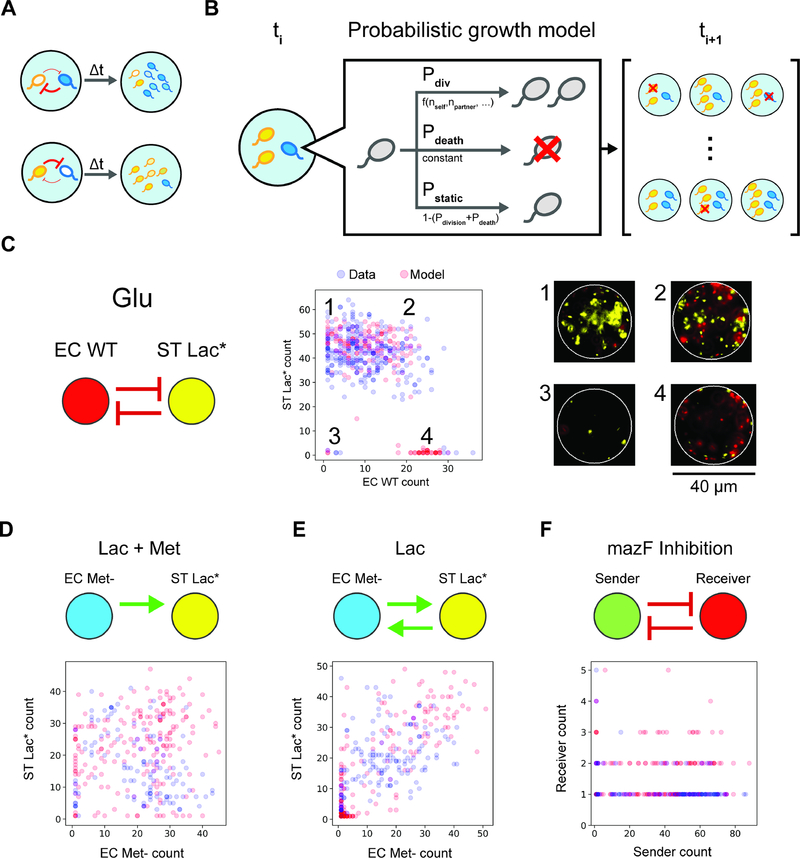
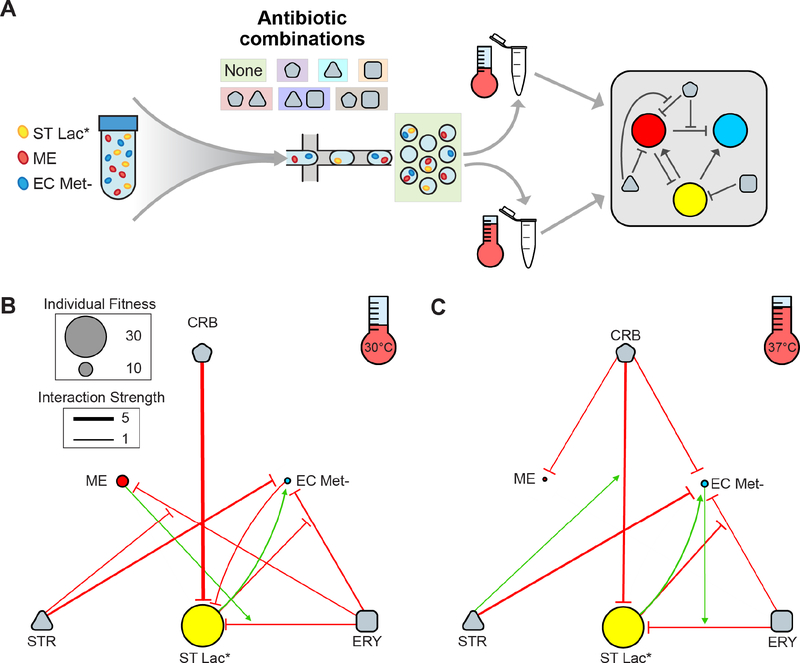
Microbial interactions are major drivers of microbial community dynamics and functions but remain challenging to identify because of limitations in parallel culturing and absolute abundance quantification of community members across environments and replicates. To this end, we developed Microbial Interaction Network Inference in microdroplets (MINI-Drop). Fluorescence microscopy coupled to computer vision techniques were used to rapidly determine the absolute abundance of each strain in hundreds to thousands of droplets per condition. We showed that MINI-Drop could accurately infer pairwise and higher-order interactions in synthetic consortia. We developed a stochastic model of community assembly to provide insight into the heterogeneity in community states across droplets. Finally, we elucidated the complex web of interactions linking antibiotics and different species in a synthetic consortium. In sum, we demonstrated a robust and generalizable method to infer microbial interaction networks by random encapsulation of sub-communities into microfluidic droplets.

Keywords: antibiotics; droplet microfluidics; microbial ecology; microbial interaction network; stochastic modeling.


Conflict of interest statement

DECLARATION OF INTERESTS

The authors declare no competing interests.

Figures

Figure 1.
Figure 1.. Overview and characterization of microbial interaction network inference in microdroplets (MINI-Drop).
(a) Overview schematic of the MINI-Drop method. A mixed microbial culture and oil are loaded into a droplet-forming microfluidic device. Cells are randomly encapsulated into droplets based on a Poisson distribution. The droplets are incubated for a period of time to allow cell growth and division and then imaged using fluorescent microscopy. A computer vision workflow rapidly identifies droplets and determines the number of each fluorescently labeled strain within each droplet (Fig. S1). A microbial interaction network is inferred based on the difference in the mean number of cells in the absence and presence of a partner strain. (b) Representative fluorescent microscopy images of droplets containing three bacterial strains labeled with YFP (ST Lac*), RFP (EC WT) or CFP (EC Met-) (see Tables S9–10). (c) Scatter plot of the dilution factor of the mixed culture vs. the log2 transform of the mean number of cells per drop (cell count distribution shown in Fig. S2a and analysis of mean fluorescence in Fig. S2b). Each data point represents the mean of 400–600 droplets and lines denote linear regression fits to the data excluding the highest dilution factor (indicated by empty circles to emphasize divergence from the linear trend). Red, yellow and blue data points correspond to EC WT, ST Lac* and EC Met-, respectively.
Figure 2.
Figure 2.. Investigating positive and negative microbial interaction networks using MINI-Drop.
(a) Schematic of the expected network for a synthetic consortium composed of an RFP-labeled E. coli methionine auxotroph (EC Met-) and a GFP-labeled B. subtilis tryptophan auxotroph (BS Trp-) (Table S1, E1). (b) Fluorescence microscopy image of representative single-species (EC Met- or BS Trp-) or two-member droplets. (c) Categorical scatter plot showing the number of BS Trp- or EC Met- cells in each droplet. The black horizontal line represents the mean and the error bars denote bootstrapped 95% confidence intervals for the mean. Gray lines denote statistically significant difference in means based on the Mann-Whitney U test (n=87, p=1.5e-6, left and n=372, p=3.8e–26, right). (d) The inferred interaction network for the EC Met-, BS Trp-consortium. The edge width is proportional to the log2 ratio of the average cell count in the presence of a partner to the average cell count in single strain droplets. Node size is proportional to the average cell count of each strain in single strain droplets. (e) Schematic of the expected network of an E. coli community that exhibits a strong unidirectional negative interaction. A GFP-labeled strain (sender) expresses LuxI, a synthetase for the quorum-sensing signal C6 acyl homoserine lactone (AHL). AHL binds to the receptor LuxR in an RFP-labeled strain (receiver) and activates the expression of a toxin MazF, generating a strong negative interaction (Table S1, E2). (f) Fluorescence microscopy image of representative droplets containing the sender strain, receiver strain or community. (g) Categorical scatter plot of the number of sender or receiver cells in each droplet in the presence or absence of a partner. The black line represents the mean and the error bars denote bootstrapped 95% confidence intervals for the mean. Gray lines denote statistically significant differences in the means (n=1512, p=2.2e–4, left, n=421, p=3.8e–14, right). (h) The inferred interaction network for the quorum sensing regulated toxin consortium.
Figure 3.
Figure 3.. The molecular composition of the environment shapes the interaction network of a three-member consortium.
(a) Schematic of the expected microbial interaction network of a three-member consortium consisting of RFP-labeled E. coli (EC WT), CFP-labeled E. coli methionine auxotroph (EC Met-), and YFP-labeled S. Typhimurium deficient in lactose metabolism (ST Lac*) in lactose minimal media lacking supplemented methionine (Table S1, E3). Secreted carbon byproducts (acetate) and methionine are represented by a triangle and rectangle, respectively. Node colors and green arrows denote the type of fluorescent reporter and positive interactions, respectively. (b) Schematic of the expected microbial interaction network in lactose minimal media supplemented with methionine (Table S1, E4). (c) Schematic of the expected microbial interaction network in glucose minimal media lacking supplemented methionine (Table S1, E5). (d) Schematic of the expected microbial interaction network in glucose minimal media supplemented with methionine (Table S1, E6). (e) Cell count distributions in lactose minimal media for EC WT (top), ST Lac* (middle) or EC Met- (bottom). The black line represents the mean and the error bars denote the bootstrapped 95% confidence intervals for the mean. The gray horizontal bars indicate a statistically significant difference (p < 0.05, Table S2) based on the Mann-Whitney U test. (f) Cell count distributions in lactose minimal media supplemented with methionine for EC WT (top), ST Lac* (middle) or EC Met- (bottom). (g) Cell count distributions in glucose minimal media for EC WT (top), ST Lac* (middle) or EC Met- (bottom). (h) Cell count distributions of EC WT (top), ST Lac* (middle) or EC Met- (bottom) in glucose minimal media supplemented with methionine. (i) Inferred interaction network in lactose minimal media lacking supplemented methionine. The edge width is proportional to the log2 ratio of the average cell count in the presence of a partner to the average cell count in the absence of the partner. Node size is proportional to the average cell count of each strain grown in isolation. (j) Inferred network in lactose minimal media supplemented with methionine. (k) Inferred interaction network in glucose minimal media lacking supplemented methionine. (l) Inferred interaction network in glucose minimal media supplemented with methionine.
Figure 4.
Figure 4.. Investigating higher-order interactions using MINI-Drop.
(a) Schematic showing an example of a higher-order interaction. Droplets containing two strains X and Z or Y and Z do not exhibit interactions. In three-member droplets, a negative or positive interaction from X and Y to Z is present and is defined as a higher-order interaction. (b) Categorical scatter plots of the number of EC Met- Lac* cells in droplets containing the single strain EC Met- Lac* (self), pairs of strains including EC Met- Lac* and EC Met- or ST Lac* or all three strains (EC Met- Lac*, EC Met- and ST Lac*). Black horizontal bars denote the mean number of cells per droplet and error bars represent the bootstrapped 95% confidence interval for the mean. The horizontal bar (gray) represents a statistically significant difference in means based on the Mann-Whitney U test (p = 1.2e–3, n = 703, Table S3). (c) Schematic showing the higher-order inferred network for the data shown in panel (b). The line width represents the inferred strength of the higher-order interaction. Node size is proportional to the average cell count of each strain grown in isolation. (d) Categorical scatter plots of the number of EC WT cells in droplets containing the single strain EC WT, two strains including EC WT and ST Lac* or EC Met- or all three strains (EC WT, ST Lac* and EC Met-) in lactose minimal media. The horizontal bar (gray) represents a statistically significant difference in means based on the Mann-Whitney U test (p = 2.9e–10, n = 296, Table S3). (e) Schematic showing a higher-order interaction inferred using the data shown in (d). The line width represents the strength of the inferred higher-order interaction. Node size is proportional to the average cell count of each strain grown in isolation.
Figure 5.
Figure 5.. Discrete-time Markov model of cell growth modified by microbial interactions can recapitulate cell count distributions in microfluidic droplets.
(a) Schematic of variability in community assembly in small populations. Stochasticity in intracellular molecular concentrations can alter the strength of microbial interactions, generating different community states (high blue cells, low yellow cells or the reciprocal). (b) Schematic of the discrete-time Markov model of cell growth modified by microbial interactions. At each time step, each cell can undergo cell division, cell death or remain static according to the probabilities Pdiv, Pdeath or Pstatic, respectively. (c) Inferred network topology using MINI-Drop (left) for the EC WT, ST Lac* consortium in glucose minimal media (Table S1, E5). Scatter plot of experimentally measured cell counts (blue circles, n=257) of EC WT and ST Lac* or model steady-states (red circles, n=200). This bidirectional negative interaction network generated qualitatively different community compositions corresponding to (1) low and high EC WT and ST Lac*, respectively, (2) high EC WT and ST Lac*, (3) low EC WT and ST Lac*, (4) high EC WT and low ST Lac*. Fluorescence microscopy images (right) of a representative droplet in each community state 1–4 are shown (right). (d) Inferred network for the EC Met-, ST Lac* consortium (top) in lactose minimal media supplemented with methionine (Table S1, E4). Scatter plot of experimentally measured cell counts (blue circles, n=118) of EC Met- and ST Lac* or model steady-states (red circles, n=200). (e) Inferred interaction network for the EC Met-, ST Lac* consortium in lactose minimal media (top, Table S1, E3). Scatter plot of experimentally measured cell counts (blue circles, n=141) of EC Met- and ST Lac* or model steady-states (red circles, n=200). (f) Inferred interaction network for the sender, receiver consortium (top, Table S1, E2). Scatter plot of experimentally measured cell counts (blue circles, n=93) of the sender and receiver strains or model steady-states (red circles, n=200).
Figure 6.
Figure 6.. Combinatorial effects of antibiotics on community interactions and assembly.
(a) Overview schematic of the experimental design. A three-member community containing ST Lac*, ME, and EC Met- in modified Hypho medium was encapsulated with no antibiotics and with each individual and pairwise combination of carbenicillin (CRB), erythromycin (ERY), and streptomycin (STR). Droplets were incubated at 30°C or 37°C prior to imaging and inte raction network inference. (b) Inferred interaction network after incubation at 30°C for 36 hr. The edg e width is proportional to the log2 ratio of the average cell count between two conditions of interest (Tables S6–8). Only those edges with p<0.05 and log2 ratio magnitude greater than 0.5 are shown (all interactions are listed in Tables S7–8). Node size is proportional to the mean number of cells in single strain droplets in the absence of antibiotics. The arrows have a sign modifier based on the level of interaction as summarized in Table S6. For example, species-antibiotic-species interactions with a value greater than 1 are visualized as an inhibitory edge pointing to an inhibitory edge, with the net result being an increase in growth of the target species. This network representation was chosen such that each edge represents the ratio between two populations of droplets differing only by the presence of one variable (i.e. species or antibiotic) and is not meant to imply mechanisms of interaction. (c) Inferred interaction network after incubation at 37°C for 18 hr.

References

    1. Adamowicz EM, Flynn J, Hunter RC, and Harcombe WR (2018). Cross-feeding modulates antibiotic tolerance in bacterial communities. ISME J. 12, 2723–2735. - PMC - PubMed
    1. Attwood MM, and Harder W (1972). A rapid and specific enrichment procedure for Hyphomicrobium spp. Antonie Van Leeuwenhoek 38, 369–377. - PubMed
    1. Bachmann H, Fischlechner M, Rabbers I, Barfa N, Branco dos Santos F, Molenaar D, and Teusink B (2013). Availability of public goods shapes the evolution of competing metabolic strategies. Proc. Natl. Acad. Sci 110, 14302–14307. - PMC - PubMed
    1. Bairey E, Kelsic ED, and Kishony R (2016). High-order species interactions shape ecosystem diversity. Nat. Commun 7, 1–7. - PMC - PubMed
    1. Berendsen RL, Pieterse CMJ, and Bakker PAHM (2012). The rhizosphere microbiome and plant health. Trends Plant Sci. 17, 478–486. - PubMed

Publication types

Substances

LinkOut - more resources