. 2019 Jun;17(3):229-247.
doi: 10.1016/j.gpb.2019.07.002. Epub 2019 Sep 5.

Whole Genome Analyses of Chinese Population and De Novo Assembly of A Northern Han Genome

Affiliations

Whole Genome Analyses of Chinese Population and De Novo Assembly of A Northern Han Genome

Zhenglin Du et al. Genomics Proteomics Bioinformatics. 2019 Jun.

Abstract

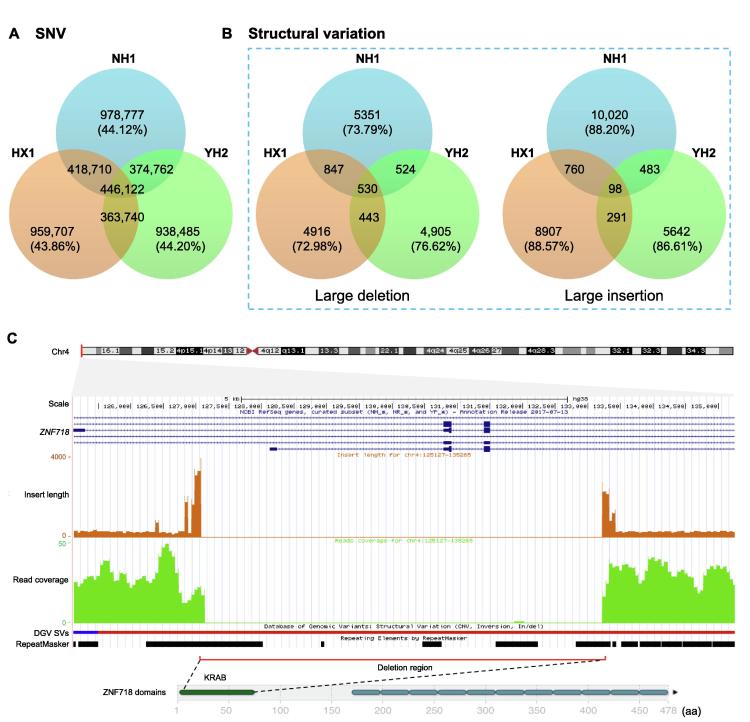
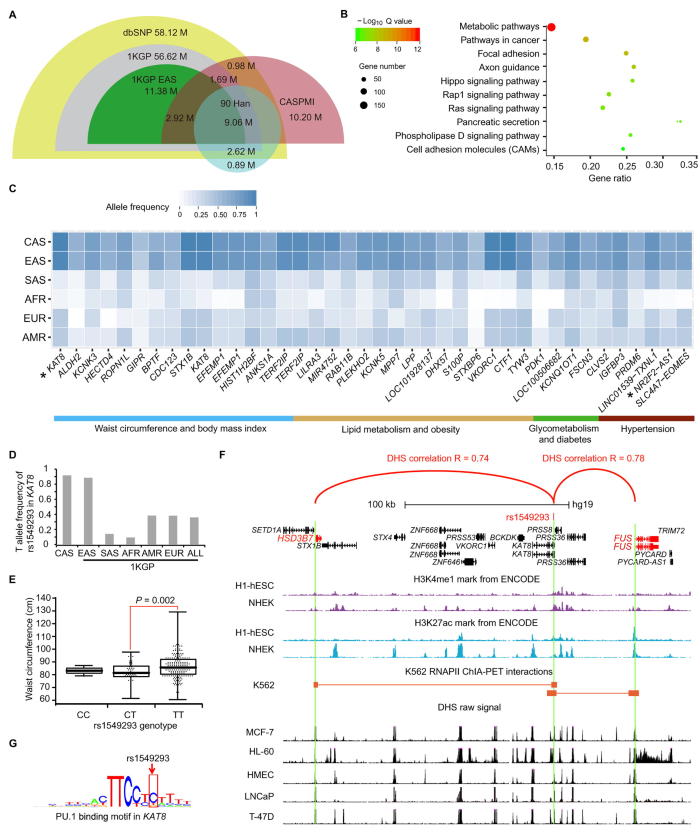
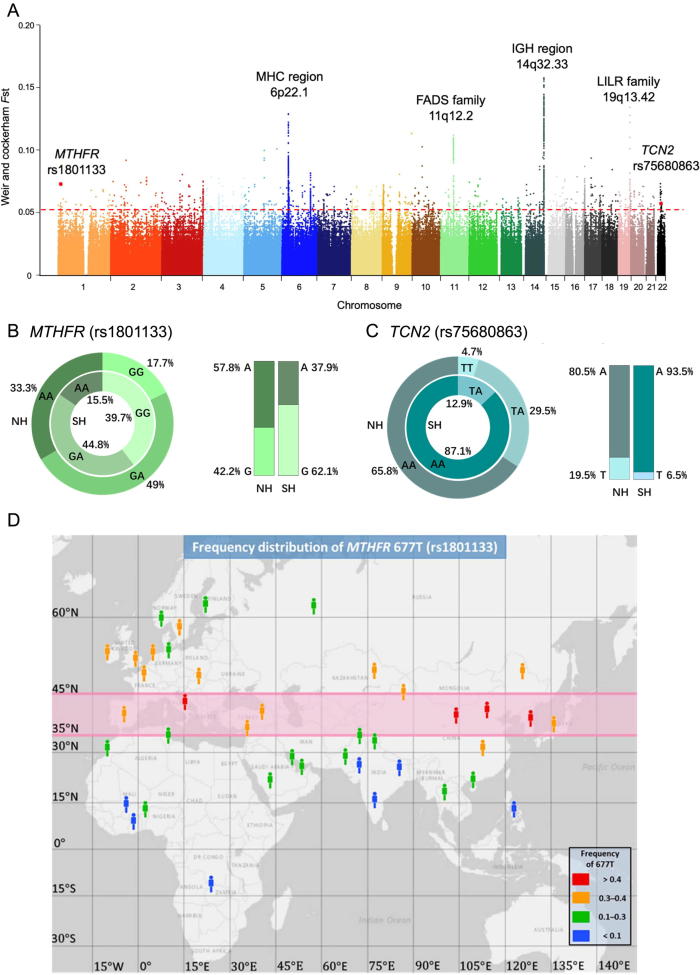
To unravel the genetic mechanisms of disease and physiological traits, it requires comprehensive sequencing analysis of large sample size in Chinese populations. Here, we report the primary results of the Chinese Academy of Sciences Precision Medicine Initiative (CASPMI) project launched by the Chinese Academy of Sciences, including the de novo assembly of a northern Han reference genome (NH1.0) and whole genome analyses of 597 healthy people coming from most areas in China. Given the two existing reference genomes for Han Chinese (YH and HX1) were both from the south, we constructed NH1.0, a new reference genome from a northern individual, by combining the sequencing strategies of PacBio, 10× Genomics, and Bionano mapping. Using this integrated approach, we obtained an N50 scaffold size of 46.63 Mb for the NH1.0 genome and performed a comparative genome analysis of NH1.0 with YH and HX1. In order to generate a genomic variation map of Chinese populations, we performed the whole-genome sequencing of 597 participants and identified 24.85 million (M) single nucleotide variants (SNVs), 3.85 M small indels, and 106,382 structural variations. In the association analysis with collected phenotypes, we found that the T allele of rs1549293 in KAT8 significantly correlated with the waist circumference in northern Han males. Moreover, significant genetic diversity in MTHFR, TCN2, FADS1, and FADS2, which associate with circulating folate, vitamin B12, or lipid metabolism, was observed between northerners and southerners. Especially, for the homocysteine-increasing allele of rs1801133 (MTHFR 677T), we hypothesize that there exists a "comfort" zone for a high frequency of 677T between latitudes of 35-45 degree North. Taken together, our results provide a high-quality northern Han reference genome and novel population-specific data sets of genetic variants for use in the personalized and precision medicine.

Keywords: De novo assembly; Large population; Phenotype association; Reference genome; Variation map.


Figures

Figure 1
Figure 1
A comparison of three Chinese reference genomes A. A Venn diagram showing the SNVs present in each of the three Chinese reference genomes and the shared SNVs. B. A Venn diagram showing the structural variations shared among the three reference genomes (large deletions on the left and large insertions on the right with SV length >50 bp). C. Top, a map of chromosome 4, showing the position of the ZNF718 gene near the telomere region. Beneath this shows ZNF718 exons at 5′ end, followed by the mean inner distance (brown) and the coverage (green) of paired-end reads. Both indicate the presence of a homozygous deletion of 6138 bp in the ZNF718 gene in NH1.0. Below the read coverage is the structural variations shown in the DGV , the short blue thick line and the connected dark red thick line indicate the gains and losses, respectively, and the black bars underneath indicate the distribution of repeat elements. Bottom, the domain structure diagram of the protein encoded by ZNF718 showing that the genomic deletion (red line) results in generation of a truncated ZNF718 protein lacking the KRAB domain (dark green). SNV, single nucleotide variant; DGV, Database of Genomic Variants.
Figure 2
Figure 2
SNV identification among projects and metabolism-related rs1549293 in KAT8 A. A comparison of SNVs found in the CASPMI project (pink) with those present in the dbSNP (olive green), 1KGP (gray), 1KGP EAS (green), and the 90 Han Chinese genome study (light blue) . B. The enrichment of KEGG pathways for genes with a high frequency of SNPs in the hfCAS-EAS dataset (a group of SNPs with relatively high frequencies in both CASPMI cohort and 1KGP EAS). X-axis represents the ratio of the number of queried genes to the number of total genes involved in each pathway (gene ratio), and y-axis shows the enriched KEGG pathways. The color scale represents Q values (log10-transformed) for each enriched pathway (hypergeometric test) and the dot size indicates the number of genes involved in a particular process or pathway. C. Genes (shown in x-axis) that are associated with the metabolism-related traits (colored bars underneath) and contain overlapping SNPs present in both hfCAS-EAS dataset and GWAS Catalog. Blue squares in different intensities illustrate frequencies of each SNP in the six populations shown on y-axis. CAS indicates participants of the CASPMI cohort in this study, while EAS, SAS, AFR, EUR, and AMR refer to the respective populations in 1KGP. Genes examined in the current study are indicated using asterisks. D. Frequency distribution of the rs1549293-T allele in the aforementioned populations. E. Association of waist circumference with different rs1549293 genotypes present in males of the CASPMI cohort (P = 0.002, t-test). F. The interaction of rs1549293 with HSD3B7 and FUS (red arcs) as revealed in various cell types by correlation assays of DHS (black peaks) and ChIA-PET (brick red lines stopping at squares), forming each of 145 kb and 54 kb chromatin interactions, respectively, via recruiting transcription factors PU.1 . The locus where rs1549293 resides is enriched with both H3K4me1 (purple) and H3K27ac (blue) modifications, suggesting an enhancer function of this region. G. rs1549293 is localized in a PU.1 binding motif. The affinity for PU.1 binding appears to be weaker with the presence of the T allele . CASPMI, Chinese Academy of Sciences Precision Medicine Initiative; 1KGP, 1000 Genomes Project; EAS, east Asian; hfCAS-EAS, relatively high-frequency SNPs of the CASPMI cohort shared with 1KGP EAS; SAS, South Asian; AFR, African; EUR, European; AMR, Admixed American; DHS, DNase I hypersensitive site.
Figure 3
Figure 3
Genetic differentiation between northern and southern Han populations in the CASPMI cohort A.Fst values between NH and SH populations in the CASPMI cohort. The red dashed horizontal line indicates the Fst cutoff of ≥0.054. Some top significant regions, genes, and missense SNPs are marked. B. Allele frequencies and genotype ratios of MTHFR rs1801133 in the NH and SH groups. C. Allele frequencies and genotype ratios of TCN2 rs75680863 in the NH and SH groups. D. A relatively high MTHFR 667T (rs1801133) belt (colored in red) between latitude 35–45° North. As demonstrated in the map produced by National Geographic Map Maker Interactive (https://mapmaker.nationalgeographic.org/), populations with higher frequencies of 667T are present in the relative central regions of the temperate zone (0.3–0.4 and above, pink belt). The frequency of 667T decreases toward north in Europe and toward south in Africa and Asia (see more details in Table S15), suggesting a selection pressure for higher MTHFR activity in more frigid as well as more tropic area. Fst, the fixation index; NH, northern Han; SH, southern Han.
Figure 4
Figure 4
The population distribution of mutational signatures A. Five COSMIC mutation signatures with patterns matching analysis of the novel singletons identified in the CASPMI cohort. The 96 types of trinucleotide mutational contexts are presented on the x axis, and y-axis shows the probability of a specific mutation occurring in such a context. B. Distribution of the five aforementioned mutational signatures in the NH and SH groups. Signature 1 showed the most significant difference between these 2 groups (P = 0.001, Wilcox rank test). Boxplots show the proportion of each mutational signature in NH (green) and SH (orange) individuals. Whiskers denote the lowest and highest values within 1.5 times the range of the first and third quartiles, respectively; dots represent outliers beyond the whiskers. C. SNPs significantly associated with the individual load of COSMIC signature 5. 17 significant SNPs were identified as being associated with the individual load of this signature (P < 10−5). Dashed horizontal line represents the significance threshold (P = 10−5). Red dots represent the significant SNPs, and black circles indicate the genes where the significant SNPs reside. COSMIC, the Catalogue of Somatic Mutations in Cancer.

Comment in

References

    1. Lander E.S., Linton L.M., Birren B., Nusbaum C., Zody M.C., Baldwin J. Initial sequencing and analysis of the human genome. Nature. 2001;409:860–921. - PubMed
    1. Wang J., Wang W., Li R., Li Y., Tian G., Goodman L. The diploid genome sequence of an Asian individual. Nature. 2008;456:60–65. - PMC - PubMed
    1. Seo J.S., Rhie A., Kim J., Lee S., Sohn M.H., Kim C.U. De novo assembly and phasing of a Korean human genome. Nature. 2016;538:243–247. - PubMed
    1. Mostovoy Y., Levy-Sakin M., Lam J., Lam E.T., Hastie A.R., Marks P. A hybrid approach for de novo human genome sequence assembly and phasing. Nat Methods. 2016;13:587–590. - PMC - PubMed
    1. Cao H., Wu H., Luo R., Huang S., Sun Y., Tong X. De novo assembly of a haplotype-resolved human genome. Nat Biotechnol. 2015;33:617–622. - PubMed

Publication types