. 2019 Nov 1:144:111626.
doi: 10.1016/j.bios.2019.111626. Epub 2019 Aug 28.

Intracellular cardiomyocytes potential recording by planar electrode array and fibroblasts co-culturing on multi-modal CMOS chip

Affiliations

Intracellular cardiomyocytes potential recording by planar electrode array and fibroblasts co-culturing on multi-modal CMOS chip

Jong Seok Park et al. Biosens Bioelectron. .

Abstract

Intracellular action potential signals reveal enriched physiological information. Patch clamp techniques have been widely used to measure intracellular potential. Despite their high signal fidelity, they suffer from low throughput. Recently, 3D nanoelectrodes have been developed for intracellular potential recording. However, they are limited by scalability, yield, and cost, directly constraining their use in monitoring large number of cells and high throughput applications. In this paper, we demonstrate intracellular potential monitoring of cardiomyocytes using simple 2D planar electrode array in a standard CMOS process without patch clamps or post fabricated 3D nanoelectrodes. This is enabled by our unique cardiomyocytes/fibroblasts co-culturing technique and electroporation. The co-cultured fibroblasts promote tight sealing of cardiomyocytes on electrodes and enable high-fidelity intracellular potential monitoring based on 2D planar electrode. Compared to existing technologies, our platform has a unique potential to achieve an unprecedented combination of throughput, spatiotemporal resolution, and a tissue-level field-of-view for cellular electrophysiology monitoring.

Keywords: CMOS; Cardiomyocytes; Cellular impedance sensing; Drug screening; Intracellular action potential recording; Multimodality sensor array.


Conflict of interest statement

Competing interests: The authors declare that they have no competing interests.

Declaration of interests

The authors declare that they have no known competing financial interests or personal relationships that could have appeared to influence the work reported in this paper.

Figures

Fig. 1.
Fig. 1.. The time-lapse impedance measurement of HEK cell with CMOS quad-modal cellular interfacing chip.
(A) The equivalent electrical circuit model of the cell-to-electrode interface impedance. (B) The CMOS quad-modal cellular interfacing array chip (Park et al., 2016, 2018a, 2018b). (C and D) The time-lapse measured HEK cell impedance (C) magnitude images and (D) phase images at 100 kHz. (E) The reference fluorescent microscope image of HEK cell.
Fig. 2.
Fig. 2.. The time-lapse measured impedance magnitude images of the mixed spheroids with different fibroblasts contents.
(A, B, and C) The impedance magnitude images of the mixed spheroids with (A) 0%, (B) 25%, and (C) 50% fibroblasts contents each with the reference fluorescent microscope images. (D, E, and F) The reference fluorescent microscope images of the mixed spheroids with the fibroblast contents of (D) 0%, (E) 25%, and (F) 50% with the addition of Calcein AM to visualize cardiomyocytes as well as non-myocytes cells. Note that the fluorescent microscope images can only visualize the cardiomyocytes without the addition of Calcein AM. The Calcein AM is added at the end of the experiments and can visualize most of the eukaryotic cells. All figures share the same impedance scale bar.
Fig. 3.
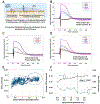
Fig. 3.. Characterization of the membrane electroporation behaviours of cardiomyocytes for different electrical pulse conditions.
(A) The sequence of the intracellular potential signal measurements. (B, C, and D) The measured potential signals after electrical pulses each with different (B) pulse amplitude, (C) number of pulses, and (D) pulse duration, while the other parameters are fixed. (E) The extracted action potential durations at 50% repolarization (APD50) versus the input-referred potential amplitudes based on 762 measured potential signals. (F) The statistical summary of the measured data in (E). The average (square) and the standard deviation (circle) of the extracted APD50s per each intracellular potential signal amplitude interval (ranging from 0.2mV to 2.2mV with the step of 0.2mV) are summarized.
Fig. 4.
Fig. 4.. Intracellular potential recording of two distinct types of cardiomyocytes.
(A and B) The intracellular potential signals of (A) NRVMs and (B) iPM cells measured at 5 different pixels with the concurrent cell pacing at 1Hz. (C) The overlay plot of the intracellular potential signals of NRVMs and iPM cells with the average line highlighted. (D) The summary of the extracted APD50 and the phase 0 upstroke velocity of NRVMs and iPM cells. (E) The long-term transient intracellular potential signals. (F) The time overlay plot of the intracellular potential signals of iPM cells recorded for 300 seconds.
Fig. 5.
Fig. 5.. Intracellular potential recording with the administration of antiarrhythmic drugs.
(A) The measured transient intracellular potentials of NRVMs with lidocaine administration. (B) The overlay plots of the intracellular potentials each with lidocaine concentration of 0nM, 10μM, and 100μM. (C) The summary of the extracted phase 0 upstroke velocities (dv/dt) and ADP80 of NRVMs each with different lidocaine concentration. (D) The measured transient intracellular potentials of iPM cells with verapamil administration. (E) The overlay plots of the intracellular potentials each with verapamil concentration of 0nM and 300nM. (F) The summary of the extracted APD50 and ADP80 of iPM cells each with different verapamil concentration.

Similar articles

Cited by

References

    1. Abbott J, Ye T, Qin L, Jorgolli M, Gertner R, Ham D, and Park H, 2017. CMOS nanoelectrode array for all-electrical intracellular electrophysiological imaging. Nat. Nanotechnol 12, 460–466. - PubMed
    1. Aiba T, Shimizu W, Inagaki M, Noda T, Miyoshi S, Ding W, Zankov D, Toyoda F, Matsuura H, Horie M, and Sunagawa K, 2005. Cellular and ionic mechanism for drug-induced long QT syndrome and effectiveness of verapamil. Journal of the American College of Cardiology 45, 300–307. - PubMed
    1. Altomare C, Terragni B, Brioschi C, Milanesi R, Pagliuca C, Viscomi C, Moroni A, Baruscotti M, and DiFrancesco D, 2003. Heteromeric HCN1-HCN4 channels: a comparison with native pacemaker channels from the rabbit sinoatrial node. J. Physiol 549, 347–359. - PMC - PubMed
    1. Asphahani F, and Zhang M, 2007. Cellular impedance biosensors for drug screening and toxin detection. Analyst. 132, 835–841. - PMC - PubMed
    1. Baumann R, Brischwein M, Schwinde A, Stegbauer K, and Wolf B, 1997. Monitoring of cellular behaviour by impedance measurements on interdigitated electrode structures Biosensor and Bioelectronics 12, 29–41. - PubMed

LinkOut - more resources