

Sequential Factorized Autoencoder for Localizing the Origin of Ventricular Activation From 12-Lead Electrocardiograms
- PMID: 31494539
- PMCID: PMC7051887
- DOI: 10.1109/TBME.2019.2939138
Sequential Factorized Autoencoder for Localizing the Origin of Ventricular Activation From 12-Lead Electrocardiograms
Abstract
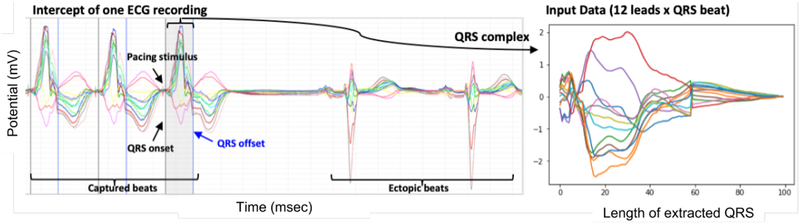
Objective: This work presents a novel approach to handle the inter-subject variations existing in the population analysis of ECG, applied for localizing the origin of ventricular tachycardia (VT) from 12-lead electrocardiograms (ECGs).
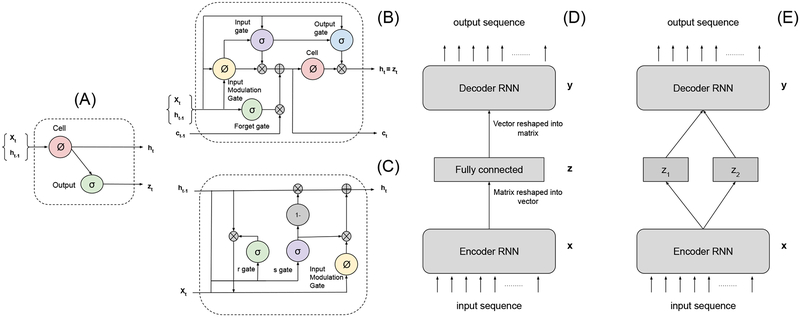
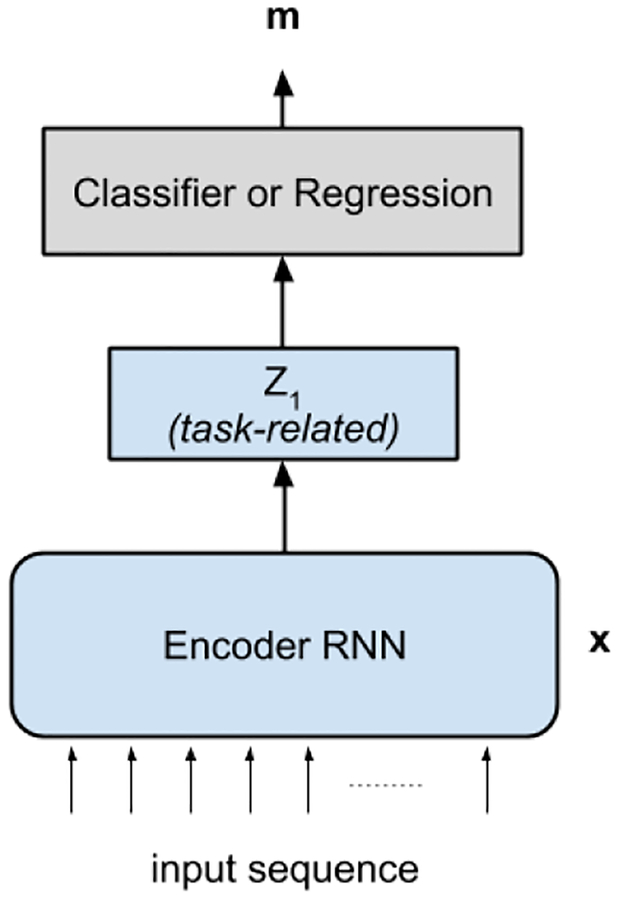
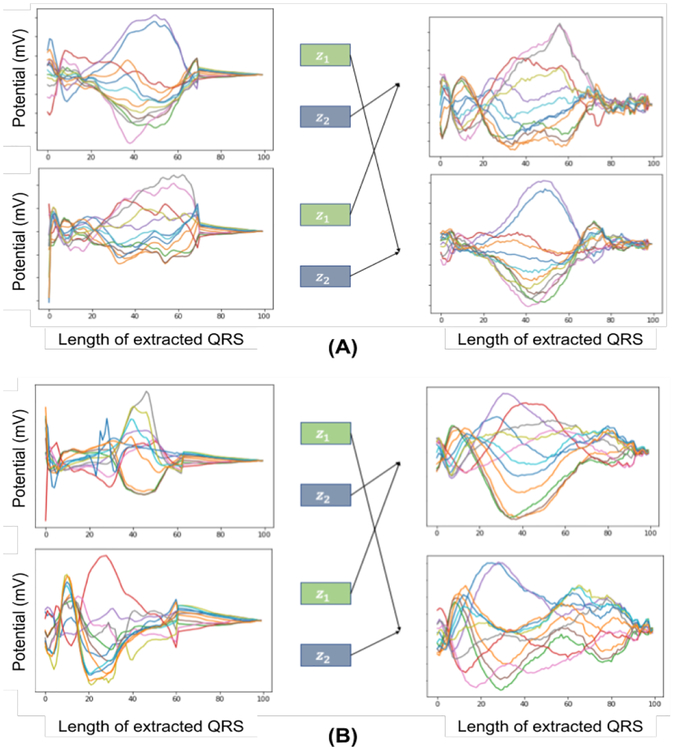
Methods: The presented method involves a factor disentangling sequential autoencoder (f-SAE) - realized in both long short-term memory (LSTM) and gated recurrent unit (GRU) networks - to learn to disentangle the inter-subject variations from the factor relating to the location of origin of VT. To perform such disentanglement, a pair-wise contrastive loss is introduced.
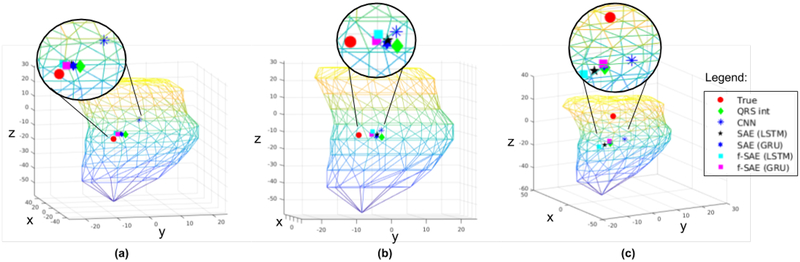
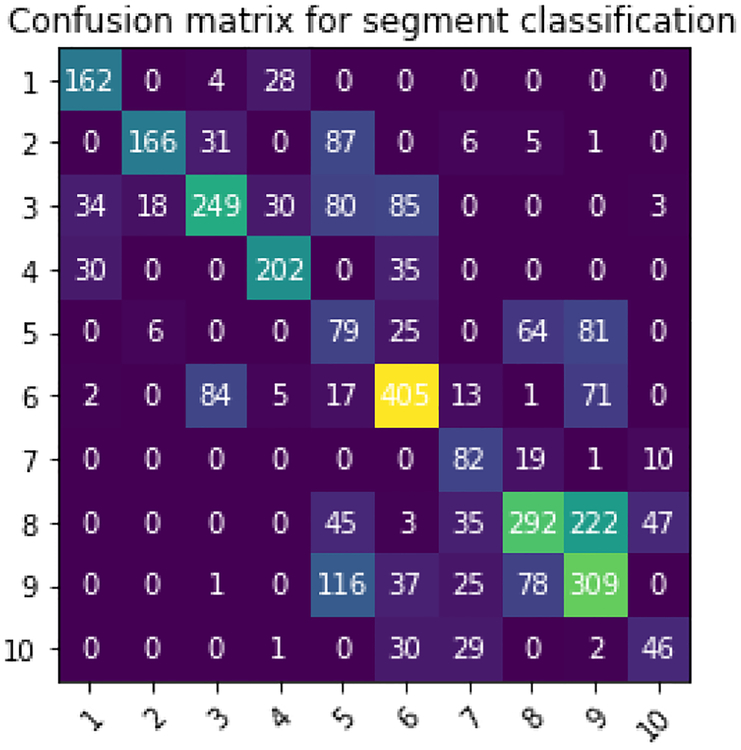
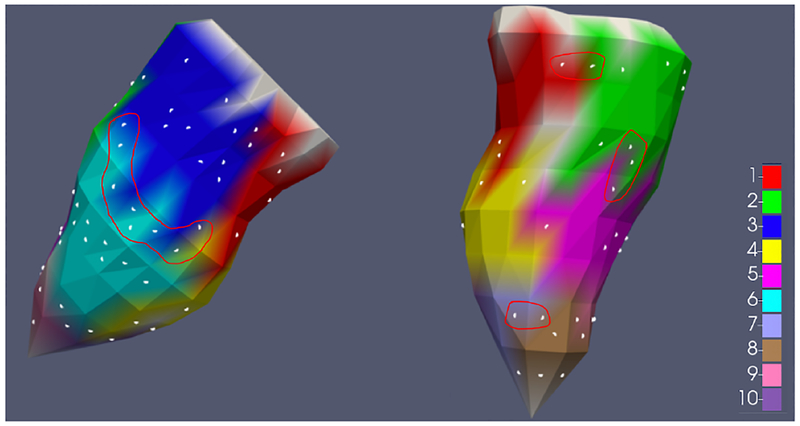
Results: The presented methods are evaluated on ECG dataset with 1012 distinct pacing sites collected from scar-related VT patients during routine pace-mapping procedures. Experiments demonstrate that, for classifying the origin of VT into the predefined segments, the presented f-SAE improves the classification accuracy by 8.94% from using prescribed QRS features, by 1.5% from the supervised deep CNN network, and 5.15% from the standard SAE without factor disentanglement. Similarly, when predicting the coordinates of the VT origin, the presented f-SAE improves the performance by 2.25 mm from using prescribed QRS features, by 1.18 mm from the supervised deep CNN network and 1.6 mm from the standard SAE.
Conclusion: These results demonstrate the importance as well as the feasibility of the presented f-SAE approach for separating inter-subject variations when using 12-lead ECG to localize the origin of VT.
Significance: This work suggests the important research direction to deal with the well-known challenge posed by inter-subject variations during population analysis from ECG signals.
Figures
Similar articles
-
Rapid 12-lead automated localization method: Comparison to electrocardiographic imaging (ECGI) in patient-specific geometry.J Electrocardiol. 2018 Nov-Dec;51(6S):S92-S97. doi: 10.1016/j.jelectrocard.2018.07.022. Epub 2018 Jul 29. J Electrocardiol. 2018. PMID: 30177365
-
Localization of the site of origin of postinfarction ventricular tachycardia by endocardial pace mapping. Body surface mapping compared with the 12-lead electrocardiogram.Circulation. 1993 Nov;88(5 Pt 1):2290-306. doi: 10.1161/01.cir.88.5.2290. Circulation. 1993. PMID: 8222124
-
A QRS axis-based algorithm to identify the origin of scar-related ventricular tachycardia in the 17-segment American Heart Association model.Heart Rhythm. 2018 Oct;15(10):1491-1497. doi: 10.1016/j.hrthm.2018.06.013. Epub 2018 Jun 11. Heart Rhythm. 2018. PMID: 29902584
-
Left ventricular outflow tract tachycardia including ventricular tachycardia from the aortic cusps and epicardial ventricular tachycardia.Herz. 2007 May;32(3):226-32. doi: 10.1007/s00059-007-2977-0. Herz. 2007. PMID: 17497256 Review.
-
Mapping for ventricular tachycardia.Card Electrophysiol Rev. 2002 Dec;6(4):436-41. doi: 10.1023/a:1021196627551. Card Electrophysiol Rev. 2002. PMID: 12438825 Review.
Cited by
-
Big Data in electrophysiology.Herzschrittmacherther Elektrophysiol. 2022 Mar;33(1):26-33. doi: 10.1007/s00399-022-00837-z. Epub 2022 Feb 8. Herzschrittmacherther Elektrophysiol. 2022. PMID: 35137276 Review. English.
-
Machine learning to predict no reflow and in-hospital mortality in patients with ST-segment elevation myocardial infarction that underwent primary percutaneous coronary intervention.BMC Med Inform Decis Mak. 2022 Apr 24;22(1):109. doi: 10.1186/s12911-022-01853-2. BMC Med Inform Decis Mak. 2022. PMID: 35462531 Free PMC article.
-
Learning to Disentangle Inter-Subject Anatomical Variations in Electrocardiographic Data.IEEE Trans Biomed Eng. 2022 Feb;69(2):860-870. doi: 10.1109/TBME.2021.3108164. Epub 2022 Jan 21. IEEE Trans Biomed Eng. 2022. PMID: 34460360 Free PMC article.
-
Improving genetic risk prediction across diverse population by disentangling ancestry representations.Commun Biol. 2023 Sep 22;6(1):964. doi: 10.1038/s42003-023-05352-6. Commun Biol. 2023. PMID: 37736834 Free PMC article.
-
From evidence-based medicine to digital twin technology for predicting ventricular tachycardia in ischaemic cardiomyopathy.J R Soc Interface. 2022 Sep;19(194):20220317. doi: 10.1098/rsif.2022.0317. Epub 2022 Sep 21. J R Soc Interface. 2022. PMID: 36128708 Free PMC article.
References
-
- PARK KYOUNG-MIN, KIM YOU-HO, and Marchlinski Francis E, “Using the surface electrocardiogram to localize the origin of idiopathic ventricular tachycardia,” Pacing and Clinical Electrophysiology, vol. 35, no. 12, pp. 1516–1527, 2012. - PubMed
-
- Miller JOHNM, Marchlinski FRANCISE, Buxton Alfred E, and Josephson Mark E, “Relationship between the 12-lead electrocardiogram during ventricular tachycardia and endocardial site of origin in patients with coronary artery disease.,” Circulation, vol. 77, no. 4, pp. 759–766, 1988. - PubMed
-
- Sapp John L, Bar-Tal Meir, Howes Adam J, Toma Jonathan E, El-Damaty Ahmed, Warren James W, MacInnis Paul J, Zhou Shijie, and Horáček B Milan, “Real-time localization of ventricular tachycardia origin from the 12-lead electrocardiogram,” JACC: Clinical Electrophysiology, vol. 3, no. 7, pp. 687–699, 2017. - PubMed
-
- Potse Mark, Linnenbank André C, Peeters Heidi AP, Sippens-Groenewegen Arne, and Crimbergen CA, “Continuous localization of cardiac activation sites using a database of multichannel ecg recordings,” IEEE transactions on biomedical engineering, vol. 47, no. 5, pp. 682–689, 2000. - PubMed
