. 2020 Jun;67(6):1548-1557.
doi: 10.1109/TBME.2019.2939686. Epub 2019 Sep 5.

Toward Image Data-Driven Predictive Modeling for Guiding Thermal Ablative Therapy

Toward Image Data-Driven Predictive Modeling for Guiding Thermal Ablative Therapy

Jarrod A Collins et al. IEEE Trans Biomed Eng. 2020 Jun.

Abstract

Objective: Accurate prospective modeling of microwave ablation (MWA) procedures can provide powerful planning and navigational information to physicians. However, patient-specific tissue properties are generally unavailable and can vary based on factors such as relative perfusion and state of disease. Therefore, a need exists for modeling frameworks that account for variations in tissue properties.

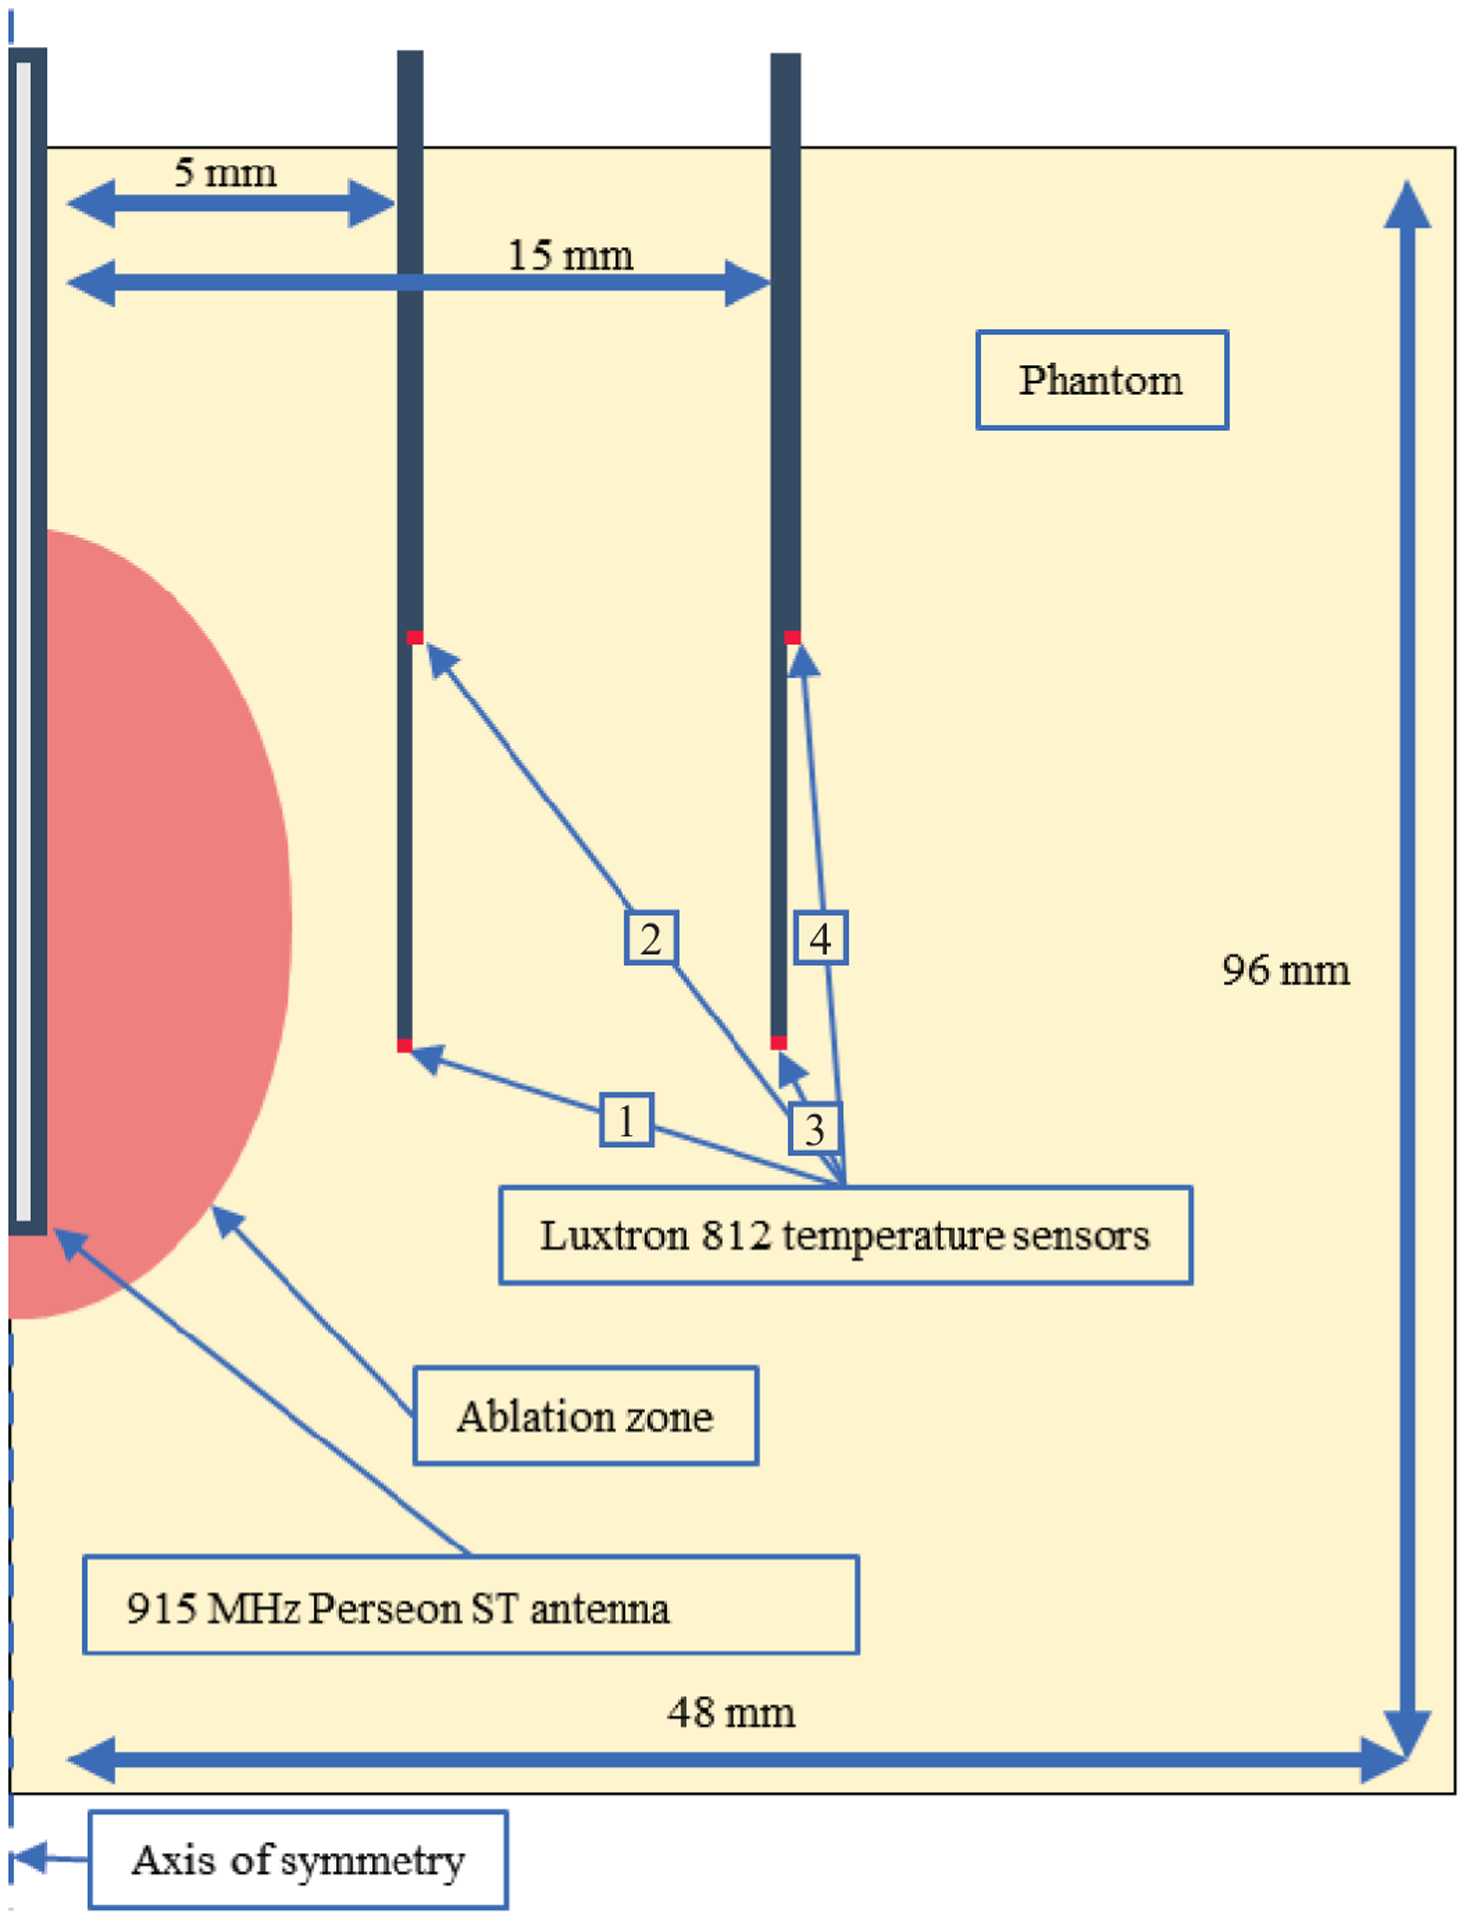
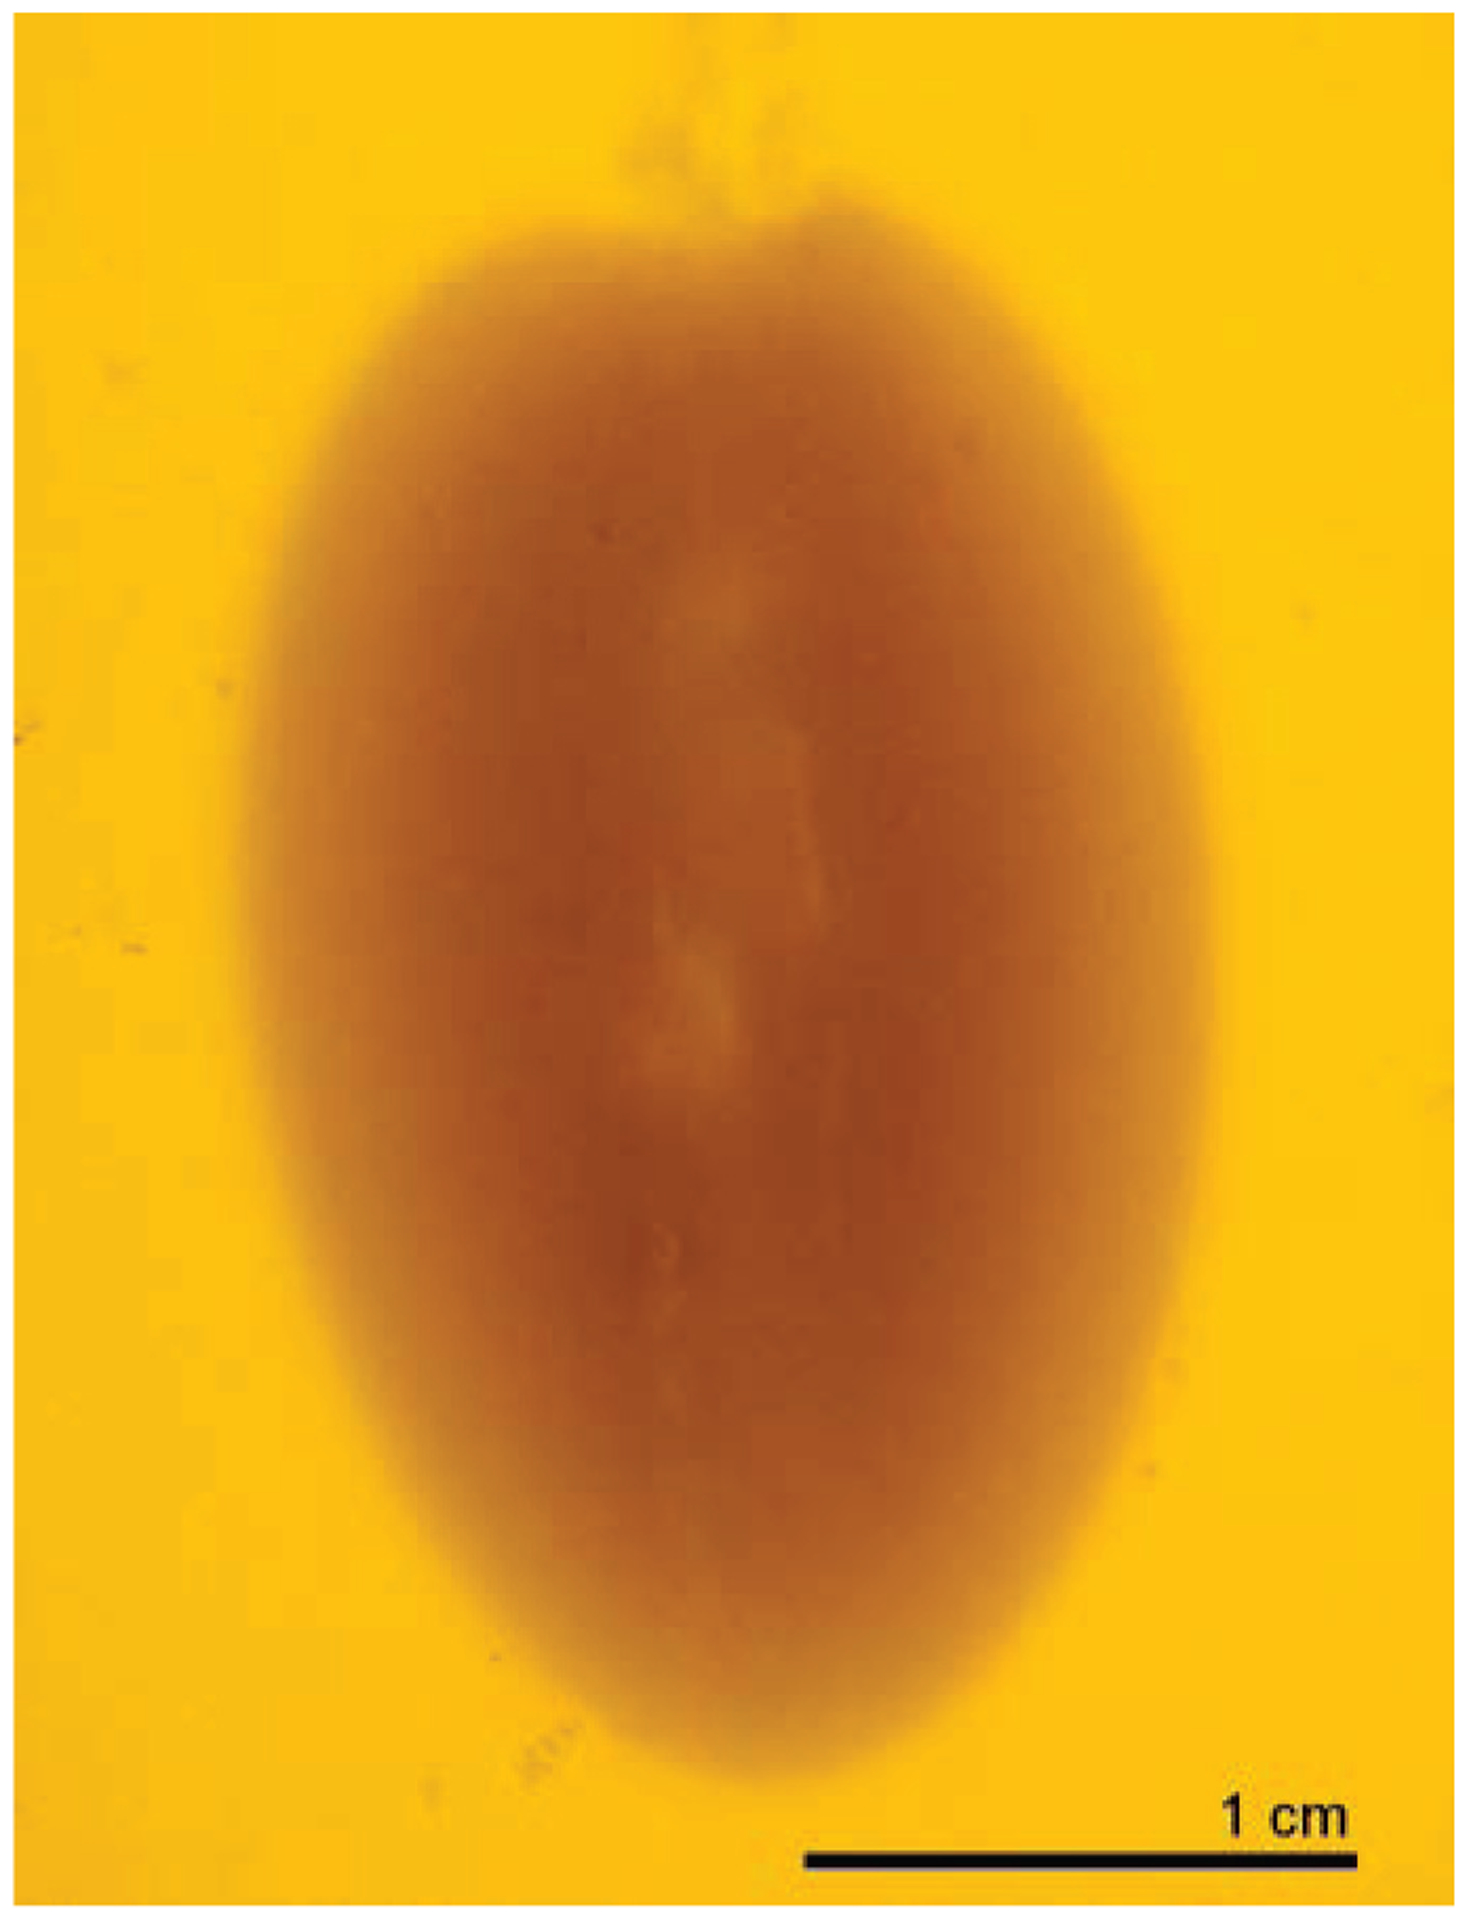
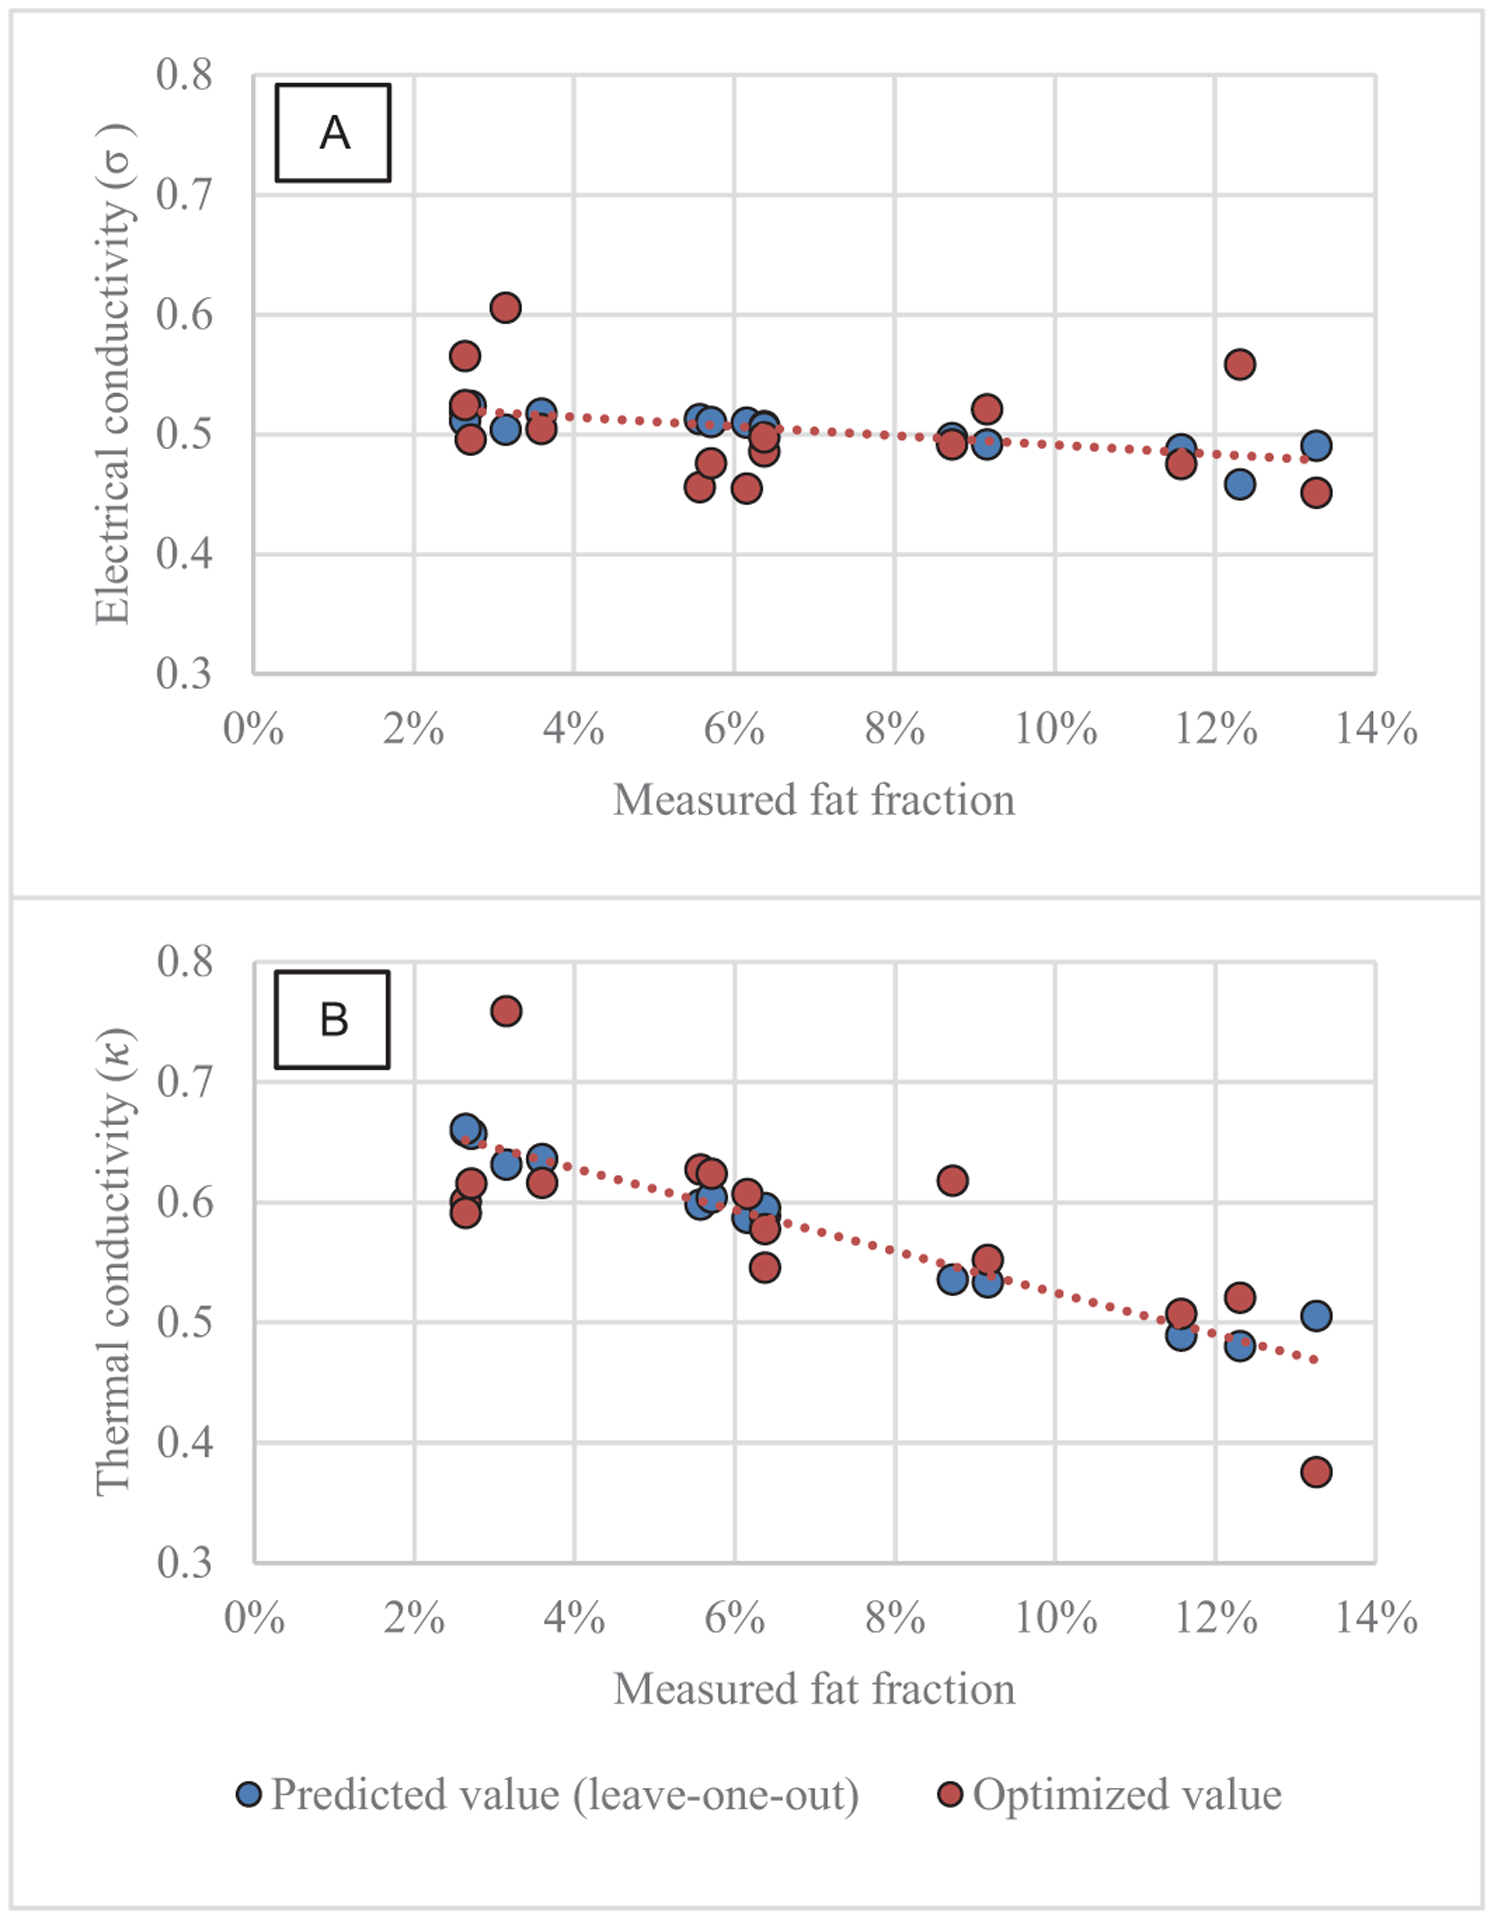
Methods: In this study, we establish an inverse modeling approach to reconstruct a set of tissue properties that best fit the model-predicted and observed ablation zone extents in a series of phantoms of varying fat content. We then create a model of these tissue properties as a function of fat content and perform a comprehensive leave-one-out evaluation of the predictive property model. Furthermore, we validate the inverse-model predictions in a separate series of phantoms that include co-recorded temperature data.

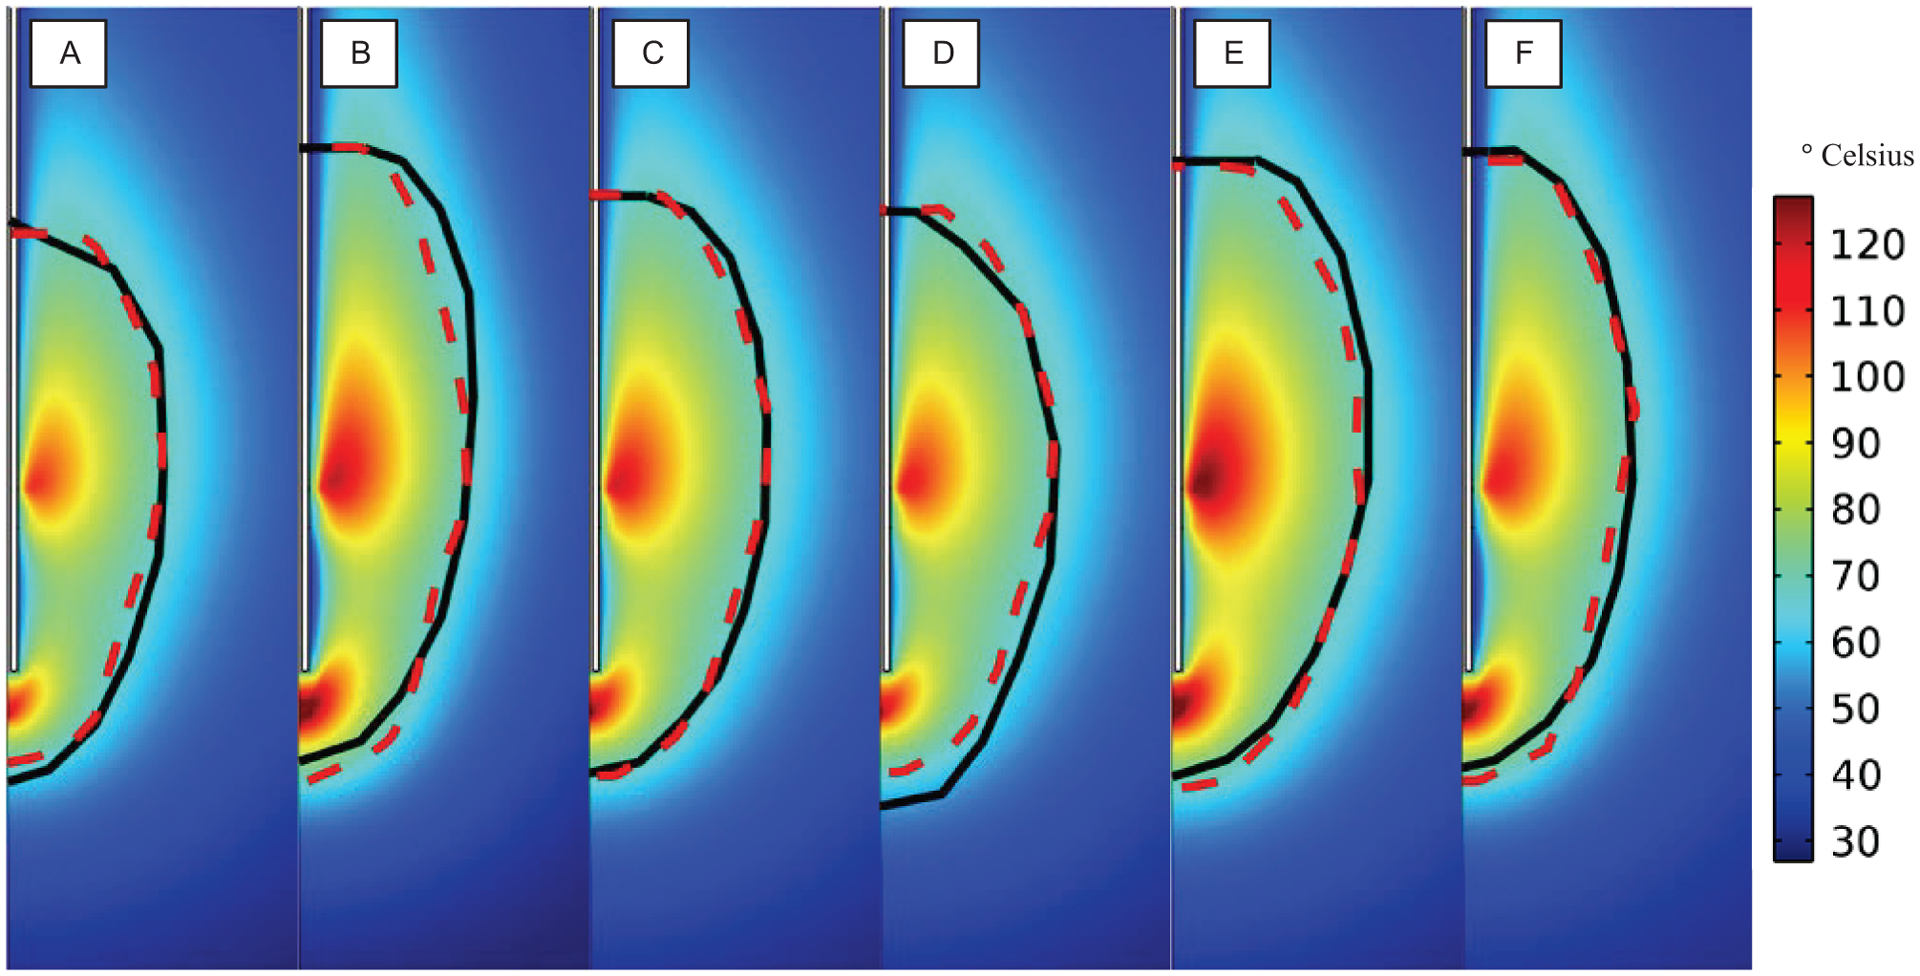
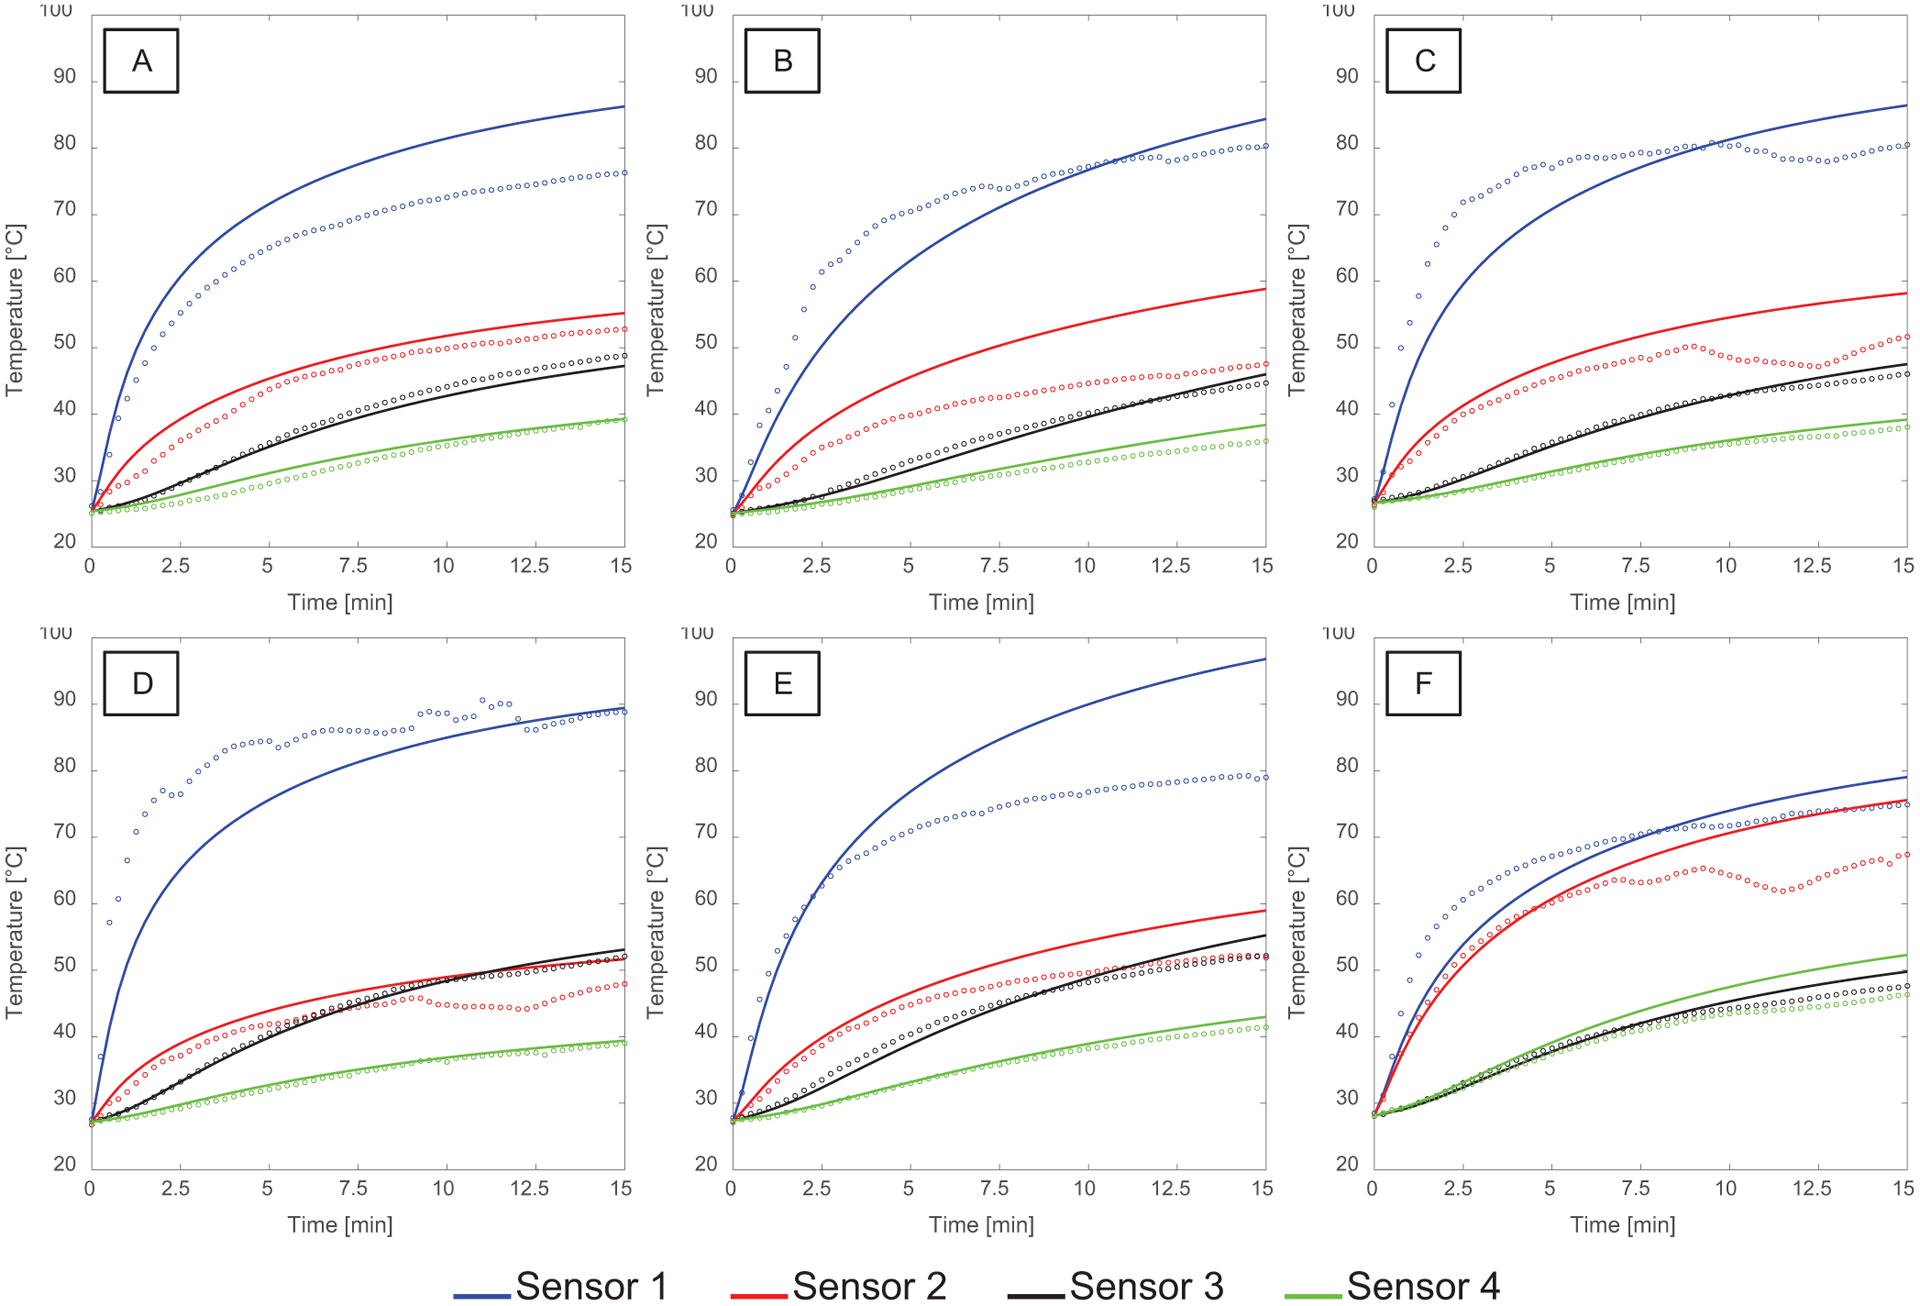
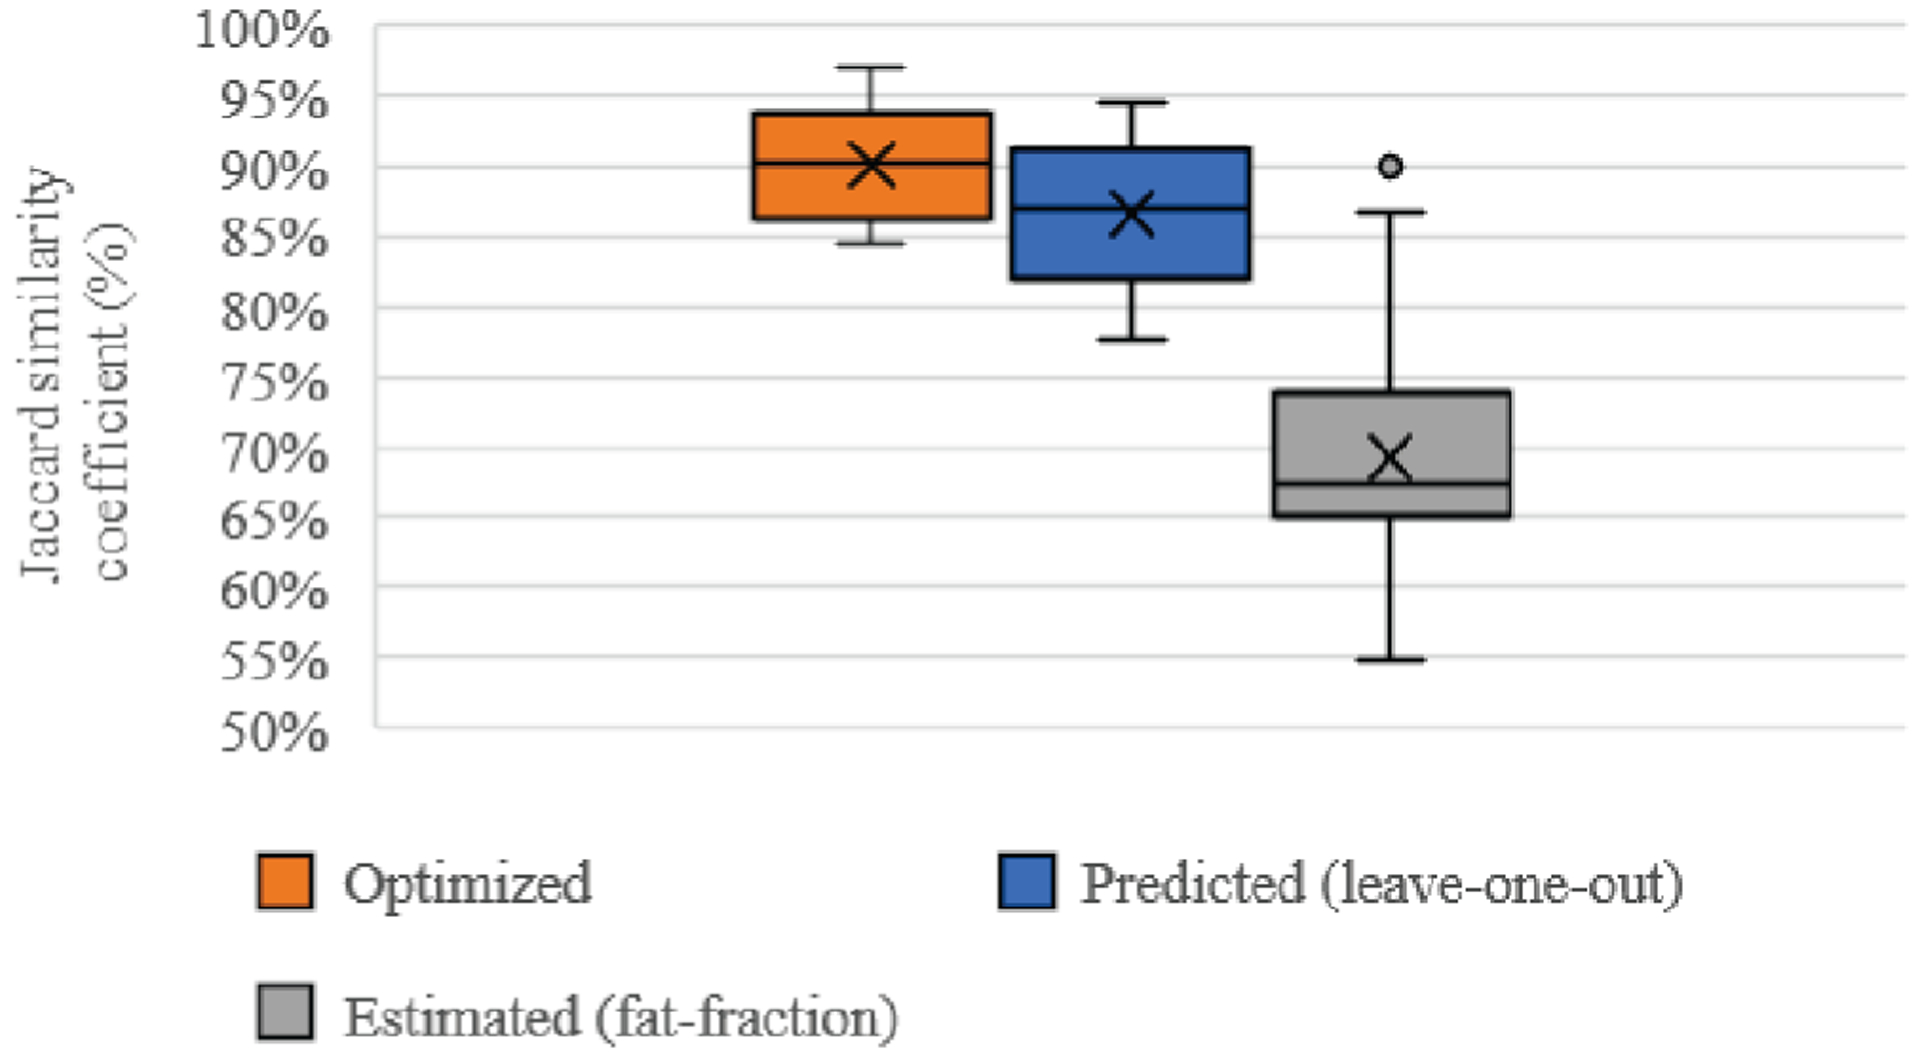
Results: This model-based approach yielded thermal profiles in close agreement with experimental measurements in the series of validation phantoms (average root-mean-square error of 4.8 °C). The model-predicted ablation zones showed compelling overlap with observed ablations in both the series of validation phantoms (93.4 ± 2.2%) and the leave-one-out cross validation study (86.6 ± 5.3%). These results demonstrate an average improvement of 17.3% in predicted ablation zone overlap when comparing the presented property-model to properties derived from phantom component volume fractions.

Conclusion: These results demonstrate accurate model-predicted ablation estimates based on image-driven determination of tissue properties.

Significance: The work demonstrates, as a proof-of-concept, that physical modeling parameters can be linked with quantitative medical imaging to improve the utility of predictive procedural modeling for MWA.


Figures

Fig. 1.
Fig. 1.
Diagram of the experimental setup and model geometry for ablation with the Perseon ST microwave ablation antenna within an agar-albumin phantom.
Fig. 2.
Fig. 2.
Sample mock gross pathology of ablation zone (cut along the axis of the Perseon ST antenna) following an ablation at 60 W for 15 minutes in an agar-albumin phantom.
Fig. 3.
Fig. 3.
Model-predicted temperature maps, observed (solid black line), and model-predicted (red dashed line) ablation zones are presented for each case (A-F) of ablation with the Perseon ST antenna at 60 W for 15 minutes within the base agar-albumin phantom used for the model validation study. The observed ablation zone contour was collected from mock gross pathology and used to drive the inverse MWA model.
Fig. 4.
Fig. 4.
Observed and model-predicted temperatures as a function of time for each case (A-F) of the base agar-albumin phantom which correspond to the ablation zones presented in Fig. 3. Observed temperatures at the four sensor locations are represented by markers while model-predicted temperatures are represented by solid lines of corresponding color. Note that, due to variability in the placement of thermal sensors, thermal profiles cannot be directly compared across cases.
Fig. 5.
Fig. 5.
Determined values of electrical conductivity (A) and thermal conductivity (B) as a function of the MRI-measured fat fraction for each of the 15 agar-albumin-fat phantom cases. The optimized value for a given case is represented by an orange marker. While the predicted value for each case from the leave-one-out evaluation is presented in blue. The orange dashed line represents a linear fit to the optimized values.
Fig. 6.
Fig. 6.
Percentage overlap between modeled and observed ablation zones for the 15 agar-albumin-fat phantom cases as represented by the Jaccard similarity coefficient. Results using the optimized (orange), leave-one-out predicted (blue), and fat-fraction estimated (grey) are presented. The box and whiskers represent the mean, median, upper and lower quartiles, maximum, and minimum Jaccard similarity coefficient from each modeling approach across the sample of 15 cases.

Similar articles

Cited by

References

    1. Leung U, Kuk D, D’Angelica MI, Kingham TP, Allen PJ, DeMatteo RP, Jarnagin WR, and Fong Y, “Long-term outcomes following microwave ablation for liver malignancies,” Br J Surg, vol. 102, pp. 85–91, 2015. - PMC - PubMed
    1. Alexander ES, Wolf FJ, Machan JT, Charpentier KP, Beland MD, Iannuccilli JD, Haas RH, and Dupuy DE, “Microwave ablation of focal hepatic malignancies regardless of size: A 9-year retrospective study of 64 patients,” Eur J Radiol, vol. 84, no. 6, pp. 1083–1090, 2015. - PubMed
    1. Martin RCG, Scoggins CR, and McMasters KM, “Safety and efficacy of microwave ablation of hepatic tumors: a prospective review of a 5-year experience,” Ann Surg Oncol, vol. 17, pp. 171–178, 2010. - PubMed
    1. Simon C, Dupuy DE, and Mayo-Smith WW, “Microwave ablation: principles and applications,” Radiographics, vol. 25, pp. S69–S83, 2005. - PubMed
    1. Correa-Gallego C, Fong Y, Gonen M, D’Angelica MI, Allen PJ, DeMatteo RP, Jarnagin WR, and Kingham TP “A retrospective comparison of microwave ablation vs. radiofrequency ablation for colorectal cancer hepatic metastases,” Ann Surg Oncol, vol. 21, no. 13, pp. 4278–4283, 2014. - PMC - PubMed

Publication types