. 2019 Nov 7;76(3):371-381.e4.
doi: 10.1016/j.molcel.2019.07.033. Epub 2019 Sep 5.

DNA Polymerase Delta Synthesizes Both Strands during Break-Induced Replication

Affiliations

DNA Polymerase Delta Synthesizes Both Strands during Break-Induced Replication

Roberto A Donnianni et al. Mol Cell. .

Abstract

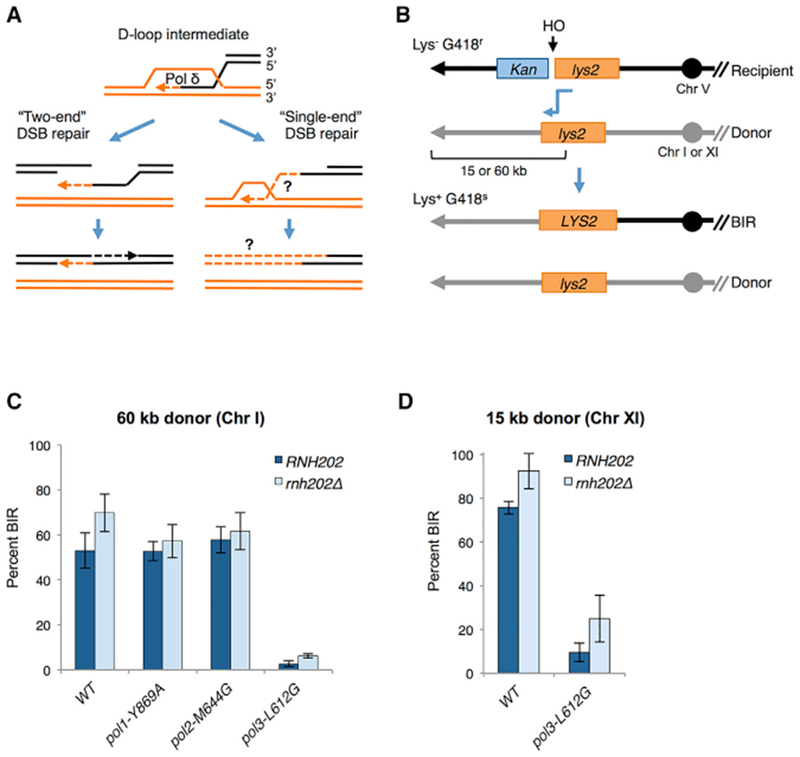
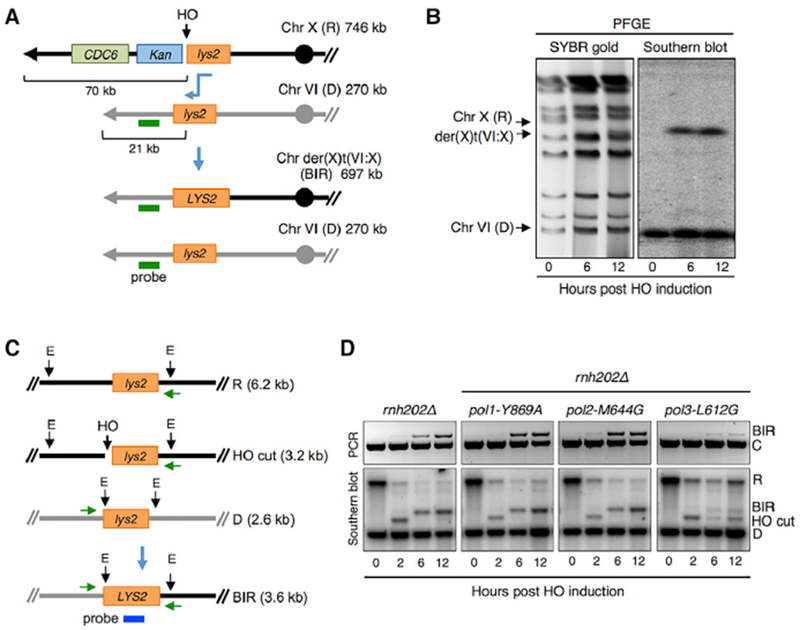
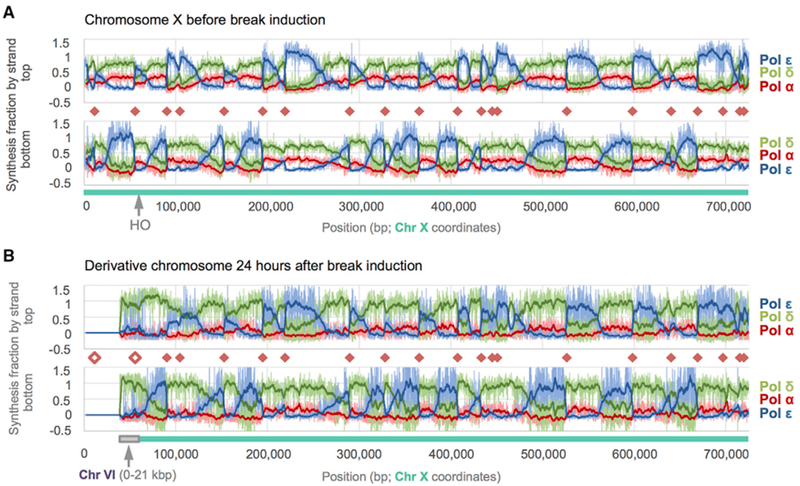
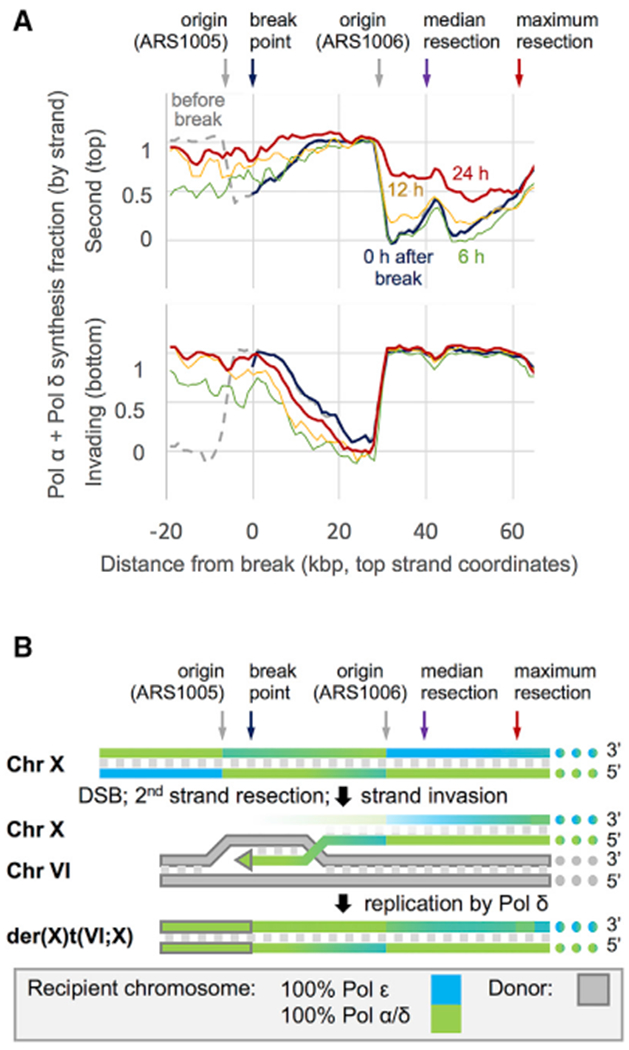
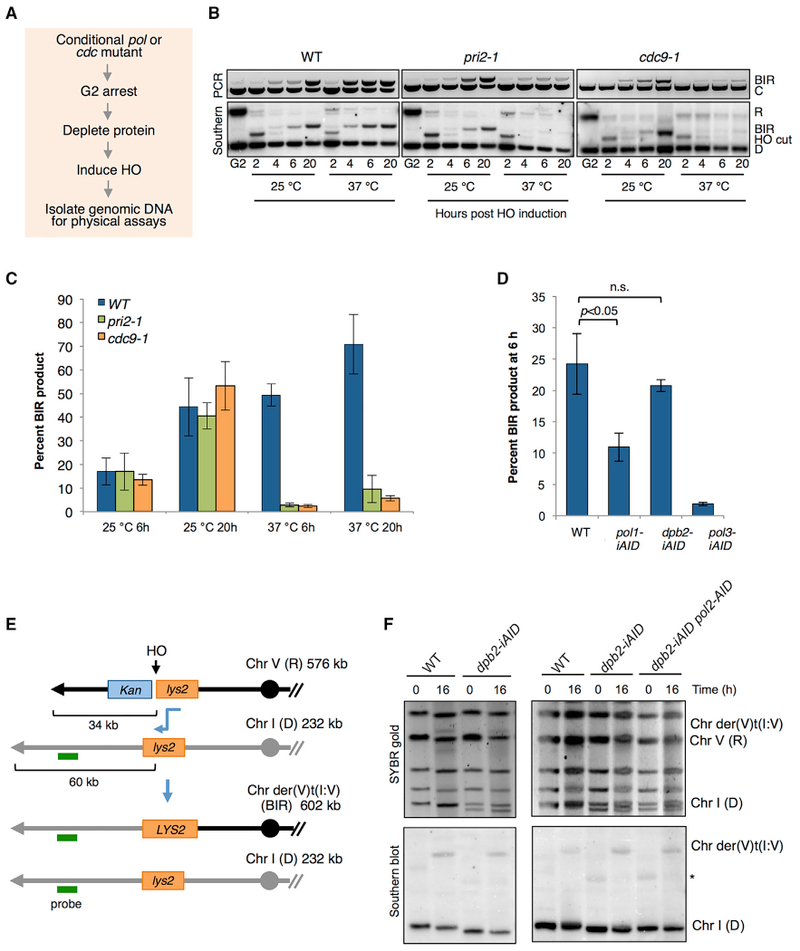
Break-induced replication (BIR) is a pathway of homology-directed repair that repairs one-ended DNA breaks, such as those formed at broken replication forks or uncapped telomeres. In contrast to conventional S phase DNA synthesis, BIR proceeds by a migrating D-loop and results in conservative synthesis of the nascent strands. DNA polymerase delta (Pol δ) initiates BIR; however, it is not known whether synthesis of the invading strand switches to a different polymerase or how the complementary strand is synthesized. By using alleles of the replicative DNA polymerases that are permissive for ribonucleotide incorporation, thus generating a signature of their action in the genome that can be identified by hydrolytic end sequencing, we show that Pol δ replicates both the invading and the complementary strand during BIR. In support of this conclusion, we show that depletion of Pol δ from cells reduces BIR, whereas depletion of Pol ε has no effect.

Keywords: DNA polymerase delta; DNA repair; break-induced replication; homologous recombination.


Conflict of interest statement

SUPPLEMENTAL INFORMATION

Supplemental Information can be found online at https://doi.org/10.1016/j.molcel.2019.07.033.

DECLARATION OF INTERESTS

The authors declare no competing interests.

Figures

Figure 1.
Figure 1.. The pol3-L612G Mutant Is Defective for BIR
(A) Homology-dependent repair initiates by invasion of a homologous duplex by a 3′ overhang formed by end resection. The invading 3′ end is extended by DNA synthesis catalyzed by DNA Pol δ. For repair of a two-end DSB by the simplest mechanism, the extended invading end displaced by a DNA helicase pairs with the other resected end of the broken duplex. Gap-filling DNA synthesis initiated at the captured 3′ end, followed by ligation, completes repair. Because there is no second end to pair with, extension of the invading end at a single-end DSB can continue to the end of the chromosome as a migrating D-loop. Synthesis of the second (top) strand must rely on de novo priming on the extended invading (bottom) strand because there is no 3′ end capture. The DNA polymerase(s) responsible for completing first-strand synthesis and synthesis of the second strand is unknown (indicated by ?). (B) Schematic of the ectopic BIR assay (see text for details). After HO cleavage, the truncated lys2 sequence on the recipient cassette invades the donor lys2 cassette, generating a functional LYS2 gene (shown by blue connecting arrow). Continued synthesis to the end of the donor chromosome generates a non-reciprocal translocation. The non-invading end produced by HO cleavage is degraded. The donor cassette is placed 60 kb from the left telomere of Chr I or 15 kb from the left telomere of Chr XI. Only the left arms of the recipient (R) and donor (D) chromosomes are shown; centromeres are indicated by solid circles and telomeres as arrowheads. Note that the native LYS2 gene on Chr II is deleted in all BIR strains, and the lys2 fragments within the D and R cassettes are encoded on the Crick strand. (C) BIR frequency of polymerase mutants in strains with the 60-kb donor. BIR frequencies were determined by colony-forming units (CFUs) Lys+ G418S YPGal/CFU YPD for each of the indicated strains from at least three independent trials; error bars show SDs. (D) BIR frequency of WT and pol3-L612G strains with the 15-kb donor from three independent trials; error bars show SD. BIR frequencies were determined as in (C). See also Figure S1 and Table S1.
Figure 2.
Figure 2.. Physical Analysis of BIR in the Ribonucleotide-Permissive DNA Polymerase Mutants
(A) Schematic of the BIR assay with the recipient cassette inserted telomere distal to the CDC6 locus on Chr X and donor cassette 21 kb from the telomere of Chr VI. The sizes of the R, D, and BIR product are indicated to the right; the horizontal green line indicates the position of the hybridization probe used to detect the BIR translocation product by PFGE. (B) Final BIR translocation product (der(X)t(VI:X)) analyzed by PFGE and SYBR gold stain for all chromosomes or Southern blot hybridization using a probe specific to a duplicated region of Chr VI. (C) Schematic of physical assays to detect BIR. Green horizontal arrows indicate the locations of primers used to monitor BIR product by PCR. Vertical black arrows show the location of EcoRV (E) sites, and sizes of digestion products for the recipient chromosome before and after HO cutting, the donor chromosome, and BIR product are indicated. The probe used for Southern blot analysis hybridizes to LYS2 sequence shared by R and D cassettes and final BIR product. (D) PCR (top panel) and Southern blot (bottom panel) of the indicated strains showing initiation and completion of BIR after HO induction. Representative images from three independent trials are shown. Control primers (“C”) were designed to amplify sequences 66-kb centromere proximal to the DSB and were included in the same reaction with primers to detect BIR. See also Figure S2 and Tables S1 and S2.
Figure 3.
Figure 3.. DNA Polymerase Enzymology on Chromosome X before and after HO Induction
Fraction of synthesis across S. cerevisiae Chr X due to each replicative polymerase as calculated from HydEn-seq end densities. Chr-X- and Chr-VI-derived sequences are indicated beneath each graph by blue-green and gray bars, respectively. Fractional synthesis contributions due to Pols α, δ, and ε data are shown in shades of red, green, and blue, respectively. Pale lines are raw fractions (100-bp bins). Dark curves are 25-bin moving averages (2.5 kb). Origins (orange diamonds) coincide with abrupt reversals in Pol α + δ versus Pol ε trends. A greater reversal on one strand indicates an origin that is often overrun by forks proceeding from a neighboring origin. (A) Synthesis fractions before double-strand break (DSB) induction mapped to the Chr X reference. (B) Synthesis fractions 24 h post-DSB are mapped to the derivative chromosome, der(X)t(VI;X). Noise increases with incubation time (compare A to B), but polymerase usage patterns remain constant beyond the DSB +60 kb. The Pol α contribution is lower (indistinguishable from noise) on both strands in the donor region than in lagging strand regions elsewhere. The unfilled orange diamonds indicate origins that were deleted during BIR. See also Figures S2–S4.
Figure 4.
Figure 4.. Polymerase Contributions and BIR Mechanism
(A) 3-kb moving averages Pol α + δ synthesis fractions before (dashed gray) and immediately after break induction (blue); polymerase usage reflects the previous round of synthesis. Sequencing depth in the donated region is low (relative to the rest of Chr X and particularly for pol3-L612G strain) through at least the first 6 h (green), and the HydEn-seq signal therein results from a mix of new synthesis and low-level residual donor DNA. By 12 h after break induction (yellow), as BIR products increase and the signal is dominated by new synthesis, the Pol α + δ contribution in the donated regions approaches 100% and begins to increase up to 50 kb outside of the donated region on the second or top strand. 5′-to-3′ resection and re-synthesis are expected on this strand. By 24 h after induction (red), the Pol α + δ contribution beyond the DSB indicates continuing resection and re-synthesis up to 60 kb from the break. The degree of the Pol α + δ contribution beyond the DSB is consistent with a median resection distance of over 40 kb. (B) A model of BIR derived from polymerase usage as measured by HydEn-seq. The scale is the same as in (A). Gradients indicate polymerase usage (full blue, 100% Pol ε; full green, 100% Pol α + δ; gray fill, donor chromosome; gray outline, donor sequence). See also Figures S3 and S4.
Figure 5.
Figure 5.. DNA Pol ε Complex Is Dispensable for BIR
(A) Schematic of protocol used to analyze conditional mutants. (B) Analysis of BIR kinetics in nocodazole-arrested cells at permissive (25°C) and upon inactivation of Pol α/primase or DNA ligase I by pri2-1 or cdc9-1 mutations, respectively, at non-permissive temperature (37°C). Primer extension PCR is shown in the top panel, and Southern blot analysis is shown in the lower panel (see Figure 2C for locations of primers and restriction endonuclease sites used to monitor BIR). (C) Quantification of BIR product detected by Southern blot hybridization at 6 h and 24 h is plotted. Error bars show SD from three trials. (D) Cells were arrested in nocodazole, and the relevant polymerase was depleted by addition of 2.5 mM IAA and 50 μg/mL Dox prior to HO induction. Graph shows quantification of BIR product by Southern blot 6 h after DSB induction. Error bars show SD (n = 3); n.s. denotes not significant. (E) Schematic of the BIR assay with the recipient cassette on Chr V and donor cassette 60 kb from the telomere of Chr I. The sizes of the R, D, and BIR product are indicated; the horizontal green line indicates the position of the hybridization probe used to detect the BIR translocation product by PFGE and Southern blot. (F) Final BIR translocation product (der(V)t(I:V)) of the indicated strains analyzed by PFGE and SYBR gold stain for all chromosomes and Southern blot hybridization using a probe specific to a duplicated region of Chr I. Representative images from three independent trials are shown. The WT and dpb2-iAID strains have a slightly different-sized Chr I because they were derived from a cross. Smaller chromosomes often show size polymorphism due to variable numbers of sub-telomeric repeats. * indicates a non-specific hybridization signal observed in some Southern blots. See also Figure S5 and Table S1.

References

    1. Acharya N, Klassen R, Johnson RE, Prakash L, and Prakash S (2011). PCNA binding domains in all three subunits of yeast DNA polymerase δ modulate its function in DNA replication. Proc. Natl. Acad. Sci. USA 108, 17927–17932. - PMC - PubMed
    1. Amberg DC, Burke DJ, and Strathern JN (2005). Methods in Yeast Genetics: A Cold Spring Harbor Laboratory Course Manual (Cold Spring Harbor Laboratory Press; ).
    1. Bhowmick R, Minocherhomji S, and Hickson ID (2016). RAD52 facilitates mitotic DNA synthesis following replication stress. Mol. Cell 64, 1117–1126. - PubMed
    1. Chung WH, Zhu Z, Papusha A, Malkova A, and Ira G (2010). Defective resection at DNA double-strand breaks leads to de novo telomere formation and enhances gene targeting. PLoS Genet. 6, e1000948. - PMC - PubMed
    1. Clausen AR, Lujan SA, Burkholder AB, Orebaugh CD, Williams JS, Clausen MF, Malc EP, Mieczkowski PA, Fargo DC, Smith DJ, and Kunkel TA (2015). Tracking replication enzymology in vivo by genomewide mapping of ribonucleotide incorporation. Nat. Struct. Mol. Biol 22, 185–191. - PMC - PubMed

Publication types

MeSH terms