. 2019 Sep 19;179(1):268-281.e13.
doi: 10.1016/j.cell.2019.07.042. Epub 2019 Sep 5.

Reconstruction of 1,000 Projection Neurons Reveals New Cell Types and Organization of Long-Range Connectivity in the Mouse Brain

Affiliations

Reconstruction of 1,000 Projection Neurons Reveals New Cell Types and Organization of Long-Range Connectivity in the Mouse Brain

Johan Winnubst et al. Cell. .

Abstract

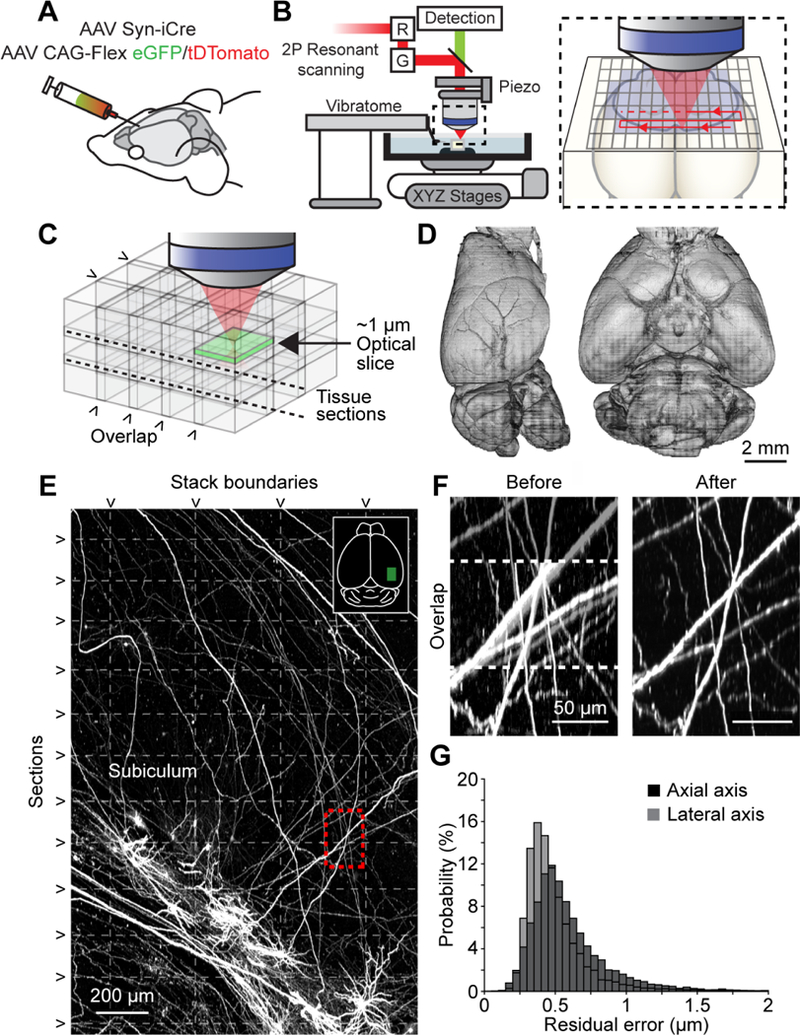
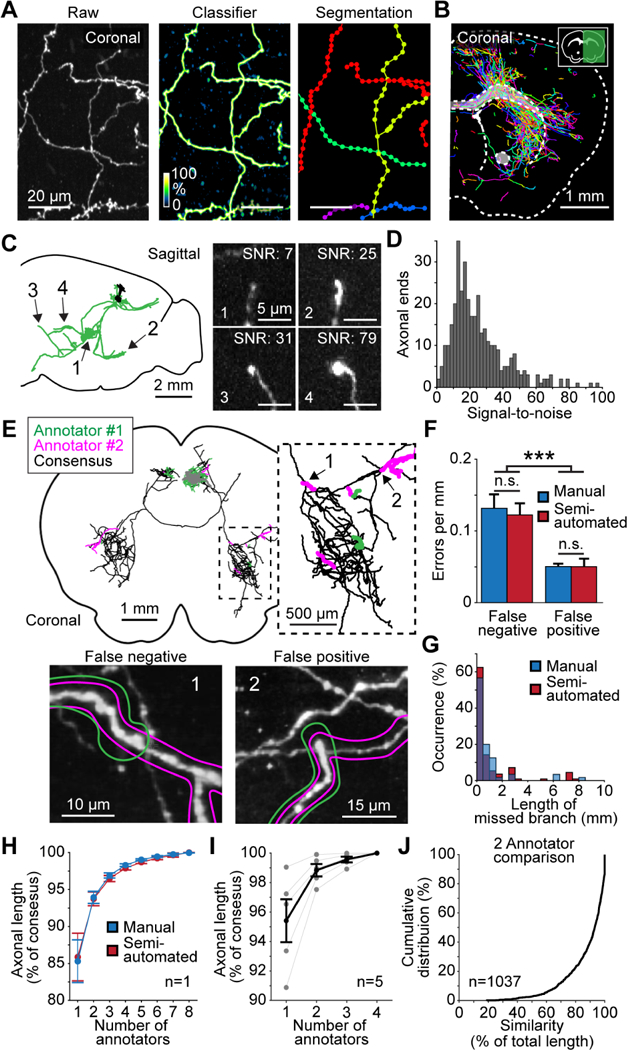
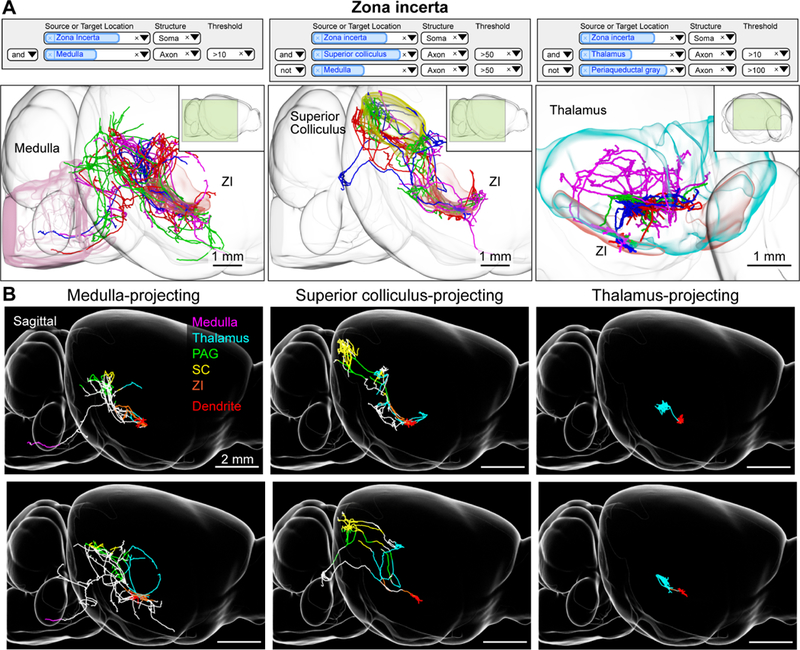
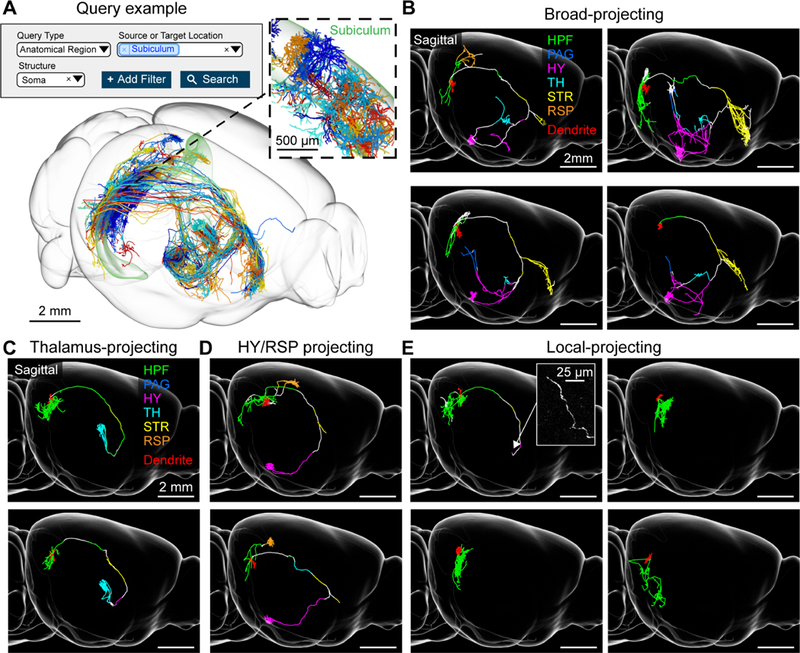
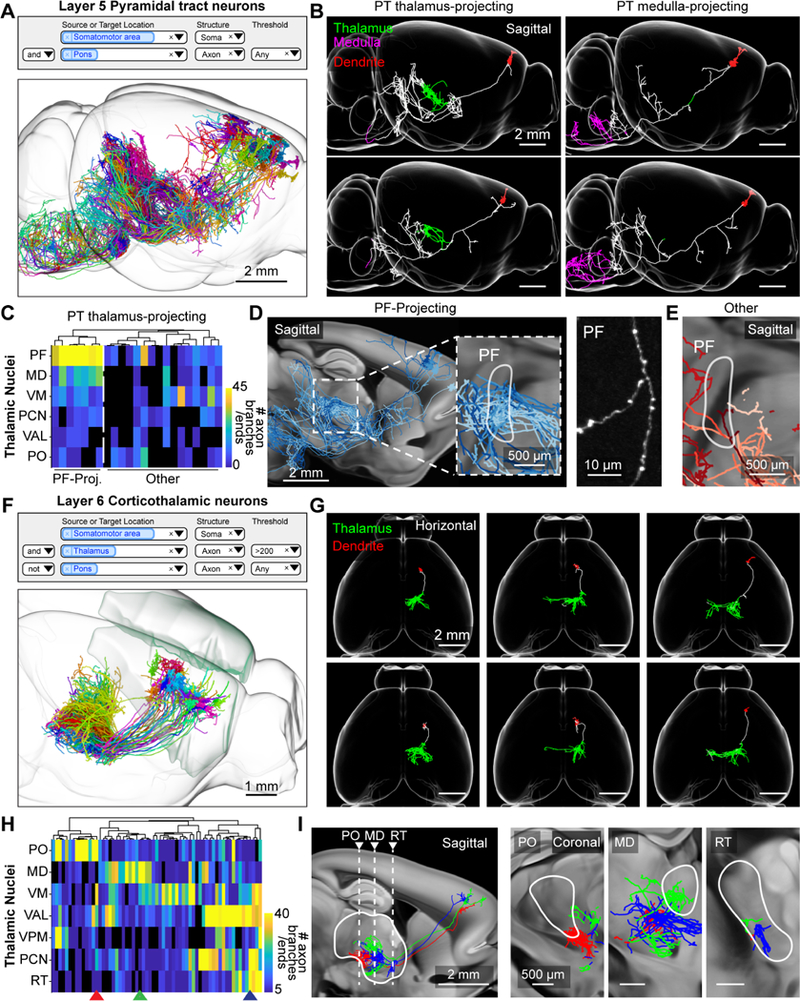
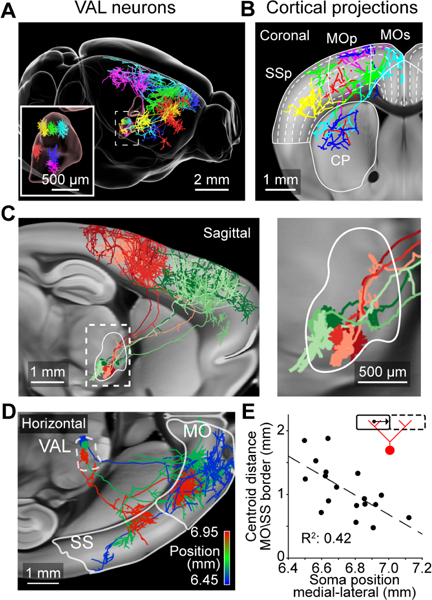
Neuronal cell types are the nodes of neural circuits that determine the flow of information within the brain. Neuronal morphology, especially the shape of the axonal arbor, provides an essential descriptor of cell type and reveals how individual neurons route their output across the brain. Despite the importance of morphology, few projection neurons in the mouse brain have been reconstructed in their entirety. Here we present a robust and efficient platform for imaging and reconstructing complete neuronal morphologies, including axonal arbors that span substantial portions of the brain. We used this platform to reconstruct more than 1,000 projection neurons in the motor cortex, thalamus, subiculum, and hypothalamus. Together, the reconstructed neurons constitute more than 85 meters of axonal length and are available in a searchable online database. Axonal shapes revealed previously unknown subtypes of projection neurons and suggest organizational principles of long-range connectivity.

Keywords: automated reconstruction; axonal morphology; long-range projections; morphology database; neuronal cell types; neuronal connectivity; projection neurons; single-cell reconstruction; whole brain.


Figures

Figure 1.
Figure 1.
Imaging pipeline. (A) Animals were injected in targeted brain areas with a combination of a low-titer AAV Syn-iCre and a high-titer AAV CAG-Flex-(eGFP/tDTomato). (B) Two-photon microscope with an integrated vibratome. Inset, sequential imaging of partially overlapping image stacks. (C) Image stacks overlapped in x, y, and z. (D) Rendered brain volume after stitching (sample 2016–10-31 in Table S2). (E) Horizontal maximum intensity projection through a 1300 × 2000 × 600 μm3 volume of the motor cortex containing labeled somata and neurites. Horizontal dashed lines mark physical tissue sections; vertical dashed line represents stack boundaries. Dashed box is region shown in F. (F) Example of boundary region between two adjacent image stacks before (left) and after stitching (right). Dashed line indicates overlap region. (G) Residual stitching error in the lateral and axial directions. See also Table S1, S2, Figure S1, and Movie S1.
Figure 2.
Figure 2.
Complete semi-automated reconstruction of individual neurons. (A) Automated segmentation. Left, raw maximum intensity image of axons in the thalamus. Middle, probability map output from classifier. Right, segmentation result, with each detected segment depicted in a different color. (B) Coronal section through a sample with overlaid segmented neurites. (C) Left, sagittal view of a reconstructed cortical neuron. Arrows indicate location of axon endings shown on the right. Right, maximum projection of axon endings several millimeters away from the soma (1: 4.1 mm; 2: 4.9 mm; 3: 6.5 mm; 4: 4.6 mm). Numbers in top right show individual signal-to-noise ratios. (D) Distribution of image signal-to-noise ratio for axon endings (difference in intensity between the axon ending and surrounding background, divided by the standard deviation of background). (E) Establishing consensus in reconstructions produced by two annotators. Top, example reconstruction of a single neuron. Black, agreement between two annotators; green and magenta, unique segments detected by one of the two annotators. Inset, higher magnification view of dashed box on the left. Bottom, images of the areas of confusion numbered in the inset shown above. Colored outlines represent the reconstructions of the two annotators. (1) False-negative error, or a missed branch. (2) False-positive error consisting of an erroneously appended branch. (F) Frequency of each error-type for manual and semiautomated reconstructions. (G) Length distribution of missed neuronal branches for manual and semi-automated reconstructions. (H) Increase in accuracy as a function of the number of annotators reaching consensus. Accuracy is the proportion of axonal length that was correctly reconstructed. The consensus reconstruction from all eight annotators was defined as 100% accurate. (I) Same analysis as shown in H for 5 neurons across the brain with reconstructions from 4 annotators. (J) Cumulative distribution of reconstruction similarity between two annotators. Similarity is the proportion of axonal length present in the reconstructions of both annotators. Error bars ± SEM. ***: p < 0.001. See also Figure S2, S3, and Movie S2.
Figure 3.
Figure 3.
Zona incerta neurons. (A) Example queries (top) and 3d visualizations (bottom) for three projection groups in the zona incerta (ZI). Left, ZI neurons with axonal projections in the medulla. Middle, ZI neurons with projections in the superior colliculus but not the medulla. Right, ZI neurons with projections in the thalamus and not the periaqueductal gray. Inset shows perspective of shown area relative to the entire brain. (B) Examples of single ZI neurons belonging to the projection groups shown in A. Axons are color coded according to anatomical position (PAG: periaqueductal gray, SC: superior colliculus, ZI: zona incerta). Dendrites are shown in red. See also Figure S4 and movie S3.
Figure 4.
Figure 4.
Subiculum neurons. (A) Example query requesting all neurons with somata in the subiculum (top) and the resulting 3d visualization (bottom). Inset, higher magnification view of area in dashed box showing the dendrites of the same cells (B) Examples of broad-projecting subiculum neurons with their axons color coded by anatomical position (HPF: hippocampal formation, PAG: periaqueductal gray, HY: hypothalamus, TH: thalamus, STR: striatum, RSP: retrosplenial cortex). Innervation in striatum is mostly confined to the lateral septum and nucleus accumbens. Dendrites are shown in red. (C) Thalamus-projecting neurons. (D) Hypothalamus/retrosplenial cortex projecting neurons. (E) Local-projecting neurons. Inset shows long-range axonal end of a local-projecting neuron that lacks varicosities. See also Figure S5.
Figure 5.
Figure 5.
Motor cortex intratelencephalic neurons. (A) Search query (top) and 3d visualization (bottom) for intratelencephalic (IT) neurons in the motor cortex classified by lack of axons in thalamus or pons. Inset, higher magnification view of area in dashed box showing the dendrites of the same cells. (B) Innervation of telencephalic targets by IT neurons. Rows correspond to projection targets. Columns represent individual IT neurons. Color denotes the axonal length for that cell in a specific area. (C) Horizontal view of individual IT neurons with axons color coded according to their anatomical position. Dendrites are shown in red. See also Figure S6.
Figure 6.
Figure 6.
Thalamus-projecting neurons in the motor cortex. (A) Search query (top) and 3d visualization (bottom) for pyramidal tract (PT) neurons in the motor cortex with axons in the pons. (B) Sagittal view of single PT neurons that project to the thalamus (PT thalamus- projecting; green) or medulla (PT medulla-projecting; magenta) respectively. (C) PT neuron projections to different nuclei of the thalamus. Rows represent thalamic nuclei (PF: parafascicular nucleus, MD: mediodorsal nucleus, VM: ventral medial nucleus, PCN: paracentral nucleus, VAL: ventral anterior-lateral complex, PO: posterior complex). Columns correspond to individual neurons. The color of the heat map denotes the total number of axonal ends and branch points. The dashed white line separates neurons with dense innervation of the PF (PF-projecting) and those without (Other). (D) Left, sagittal view of PF-projecting neurons in shades of blue. Right, example image of axon in PF with varicosities. (E) Same area as in D, with PT thalamus-projecting neurons that do not project to PF in shades of red. (F) Search query (top) and 3d visualization (bottom) of layer 6 CT (L6-CT) neurons in the motor cortex. Neurons are identified by the presence of axons in the thalamus and the lack of projections to the pons. (G) Horizontal view of single L6-CT neurons and their axonal projections to the thalamus (green). Dendrites are red. (H) L6-CT neuron projections to thalamus. Rows, thalamic nuclei (PO: posterior complex, MD: mediodorsal nucleus, VM: ventral medial nucleus of the thalamus, VAL: ventral anterior-lateral complex of the thalamus, VPM: ventral posteromedial nucleus of the thalamus, PCN: paracentral nucleus, RT: reticular nucleus); columns represent individual neurons. The color of the heat map indicates the number of axon branches and ends. (I) Thalamic projections of example neurons (arrowheads in H). Left, dashed lines indicate the coronal views on the right. Greyscale images are from the Allen anatomical template. See also Figure S7 and Movie S4.
Figure 7.
Figure 7.
Cortical projections from neurons in the VAL complex of the thalamus. (A) Six VAL neurons and their axonal projections. (B) Coronal view of the same neurons. Dashed lines show position of cortical layers. (C) Left, sagittal view of two groups of VAL neurons with similar projection patterns in the posterior (red; n = 3 cells) or anterior (green; n = 3 cells) motor cortex. Right, higher magnification view of dashed box on the left. (D) Horizontal view of cortical projections of three neurons in caudomedial VAL, color coded according to their medial lateral position. White outline show locations of motor (MO) and sensory cortex (SS). (E) Relationship between somatic medial-lateral position and the average distance of the axonal centroid in the motor (MO) and sensory cortex (SS) to the border of those two areas (illustrated by inset). Positions are in CCF coordinates. Greyscale images are from the Allen anatomical template. See also Movie S5.

Similar articles

  • A platform for brain-wide imaging and reconstruction of individual neurons.
    Economo MN, Clack NG, Lavis LD, Gerfen CR, Svoboda K, Myers EW, Chandrashekar J. Economo MN, et al. Elife. 2016 Jan 20;5:e10566. doi: 10.7554/eLife.10566. Elife. 2016. PMID: 26796534 Free PMC article.
  • Morphological diversity of single neurons in molecularly defined cell types.
    Peng H, Xie P, Liu L, Kuang X, Wang Y, Qu L, Gong H, Jiang S, Li A, Ruan Z, Ding L, Yao Z, Chen C, Chen M, Daigle TL, Dalley R, Ding Z, Duan Y, Feiner A, He P, Hill C, Hirokawa KE, Hong G, Huang L, Kebede S, Kuo HC, Larsen R, Lesnar P, Li L, Li Q, Li X, Li Y, Li Y, Liu A, Lu D, Mok S, Ng L, Nguyen TN, Ouyang Q, Pan J, Shen E, Song Y, Sunkin SM, Tasic B, Veldman MB, Wakeman W, Wan W, Wang P, Wang Q, Wang T, Wang Y, Xiong F, Xiong W, Xu W, Ye M, Yin L, Yu Y, Yuan J, Yuan J, Yun Z, Zeng S, Zhang S, Zhao S, Zhao Z, Zhou Z, Huang ZJ, Esposito L, Hawrylycz MJ, Sorensen SA, Yang XW, Zheng Y, Gu Z, Xie W, Koch C, Luo Q, Harris JA, Wang Y, Zeng H. Peng H, et al. Nature. 2021 Oct;598(7879):174-181. doi: 10.1038/s41586-021-03941-1. Epub 2021 Oct 6. Nature. 2021. PMID: 34616072 Free PMC article.
  • GTree: an Open-source Tool for Dense Reconstruction of Brain-wide Neuronal Population.
    Zhou H, Li S, Li A, Huang Q, Xiong F, Li N, Han J, Kang H, Chen Y, Li Y, Lin H, Zhang YH, Lv X, Liu X, Gong H, Luo Q, Zeng S, Quan T. Zhou H, et al. Neuroinformatics. 2021 Apr;19(2):305-317. doi: 10.1007/s12021-020-09484-6. Neuroinformatics. 2021. PMID: 32844332
  • Single-neuron axonal reconstruction: The search for a wiring diagram of the brain.
    Economo MN, Winnubst J, Bas E, Ferreira TA, Chandrashekar J. Economo MN, et al. J Comp Neurol. 2019 Sep 1;527(13):2190-2199. doi: 10.1002/cne.24674. Epub 2019 Mar 21. J Comp Neurol. 2019. PMID: 30859571 Review.
  • Long distance projections of cortical pyramidal neurons.
    Gerfen CR, Economo MN, Chandrashekar J. Gerfen CR, et al. J Neurosci Res. 2018 Sep;96(9):1467-1475. doi: 10.1002/jnr.23978. Epub 2016 Nov 12. J Neurosci Res. 2018. PMID: 27862192 Free PMC article. Review.

Cited by

References

    1. Acciai L, Soda P, and lannello G (2016). Automated Neuron Tracing Methods: An Updated Account. Neuroinformatics 14, 353–367. - PubMed
    1. Aggleton JP, and Christiansen K (2015). The subiculum. In Progress in Brain Research, (Elsevier), 65–82. - PubMed
    1. Anderson JC, Binzegger T, Douglas RJ, and Martin KA (2002). Chance or design? Some specific considerations concerning synaptic boutons in cat visual cortex. J Neurocytol 31, 211–229. - PubMed
    1. Arlotta P, Molyneaux BJ, Chen J, Inoue J, Kominami R, and Macklis JD (2005). Neuronal Subtype-Specific Genes that Control Corticospinal Motor Neuron Development In Vivo. Neuron 45, 207–221. - PubMed
    1. Ascoli GA, and Wheeler DW (2016). In search of a periodic table of the neurons: Axonaldendritic circuitry as the organizing principle. BioEssays News Rev. Mol. Cell. Dev. Biol. 38, 969–976. - PMC - PubMed

Publication types