. 2019 Nov 6;104(3):451-457.e3.
doi: 10.1016/j.neuron.2019.08.004. Epub 2019 Sep 5.

Functional Logic of Layer 2/3 Inhibitory Connectivity in the Ferret Visual Cortex

Affiliations

Functional Logic of Layer 2/3 Inhibitory Connectivity in the Ferret Visual Cortex

Benjamin Scholl et al. Neuron. .

Abstract

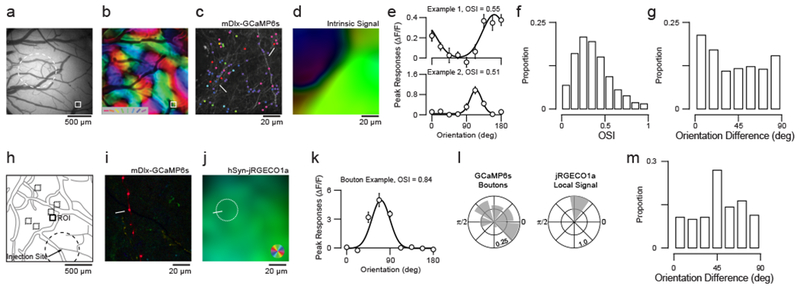
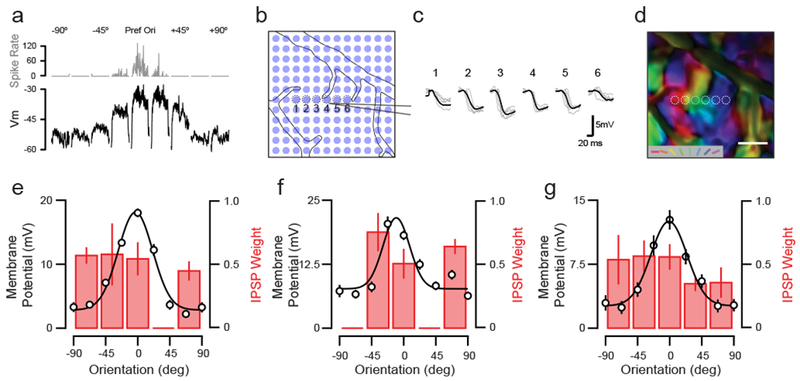
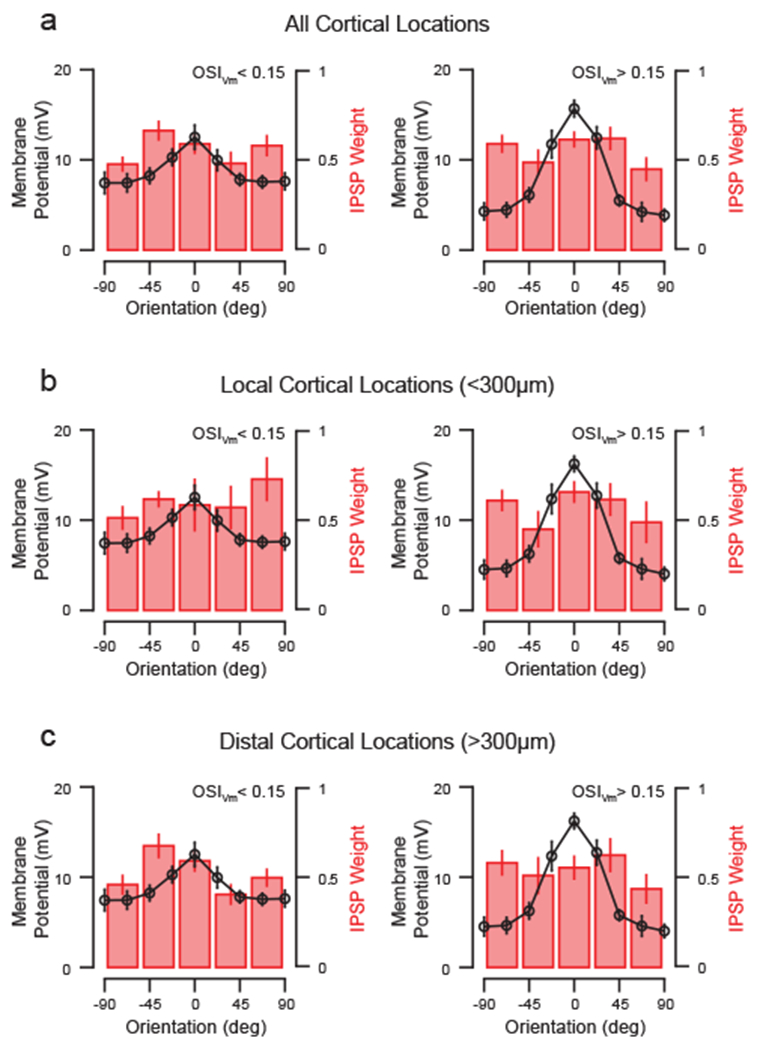
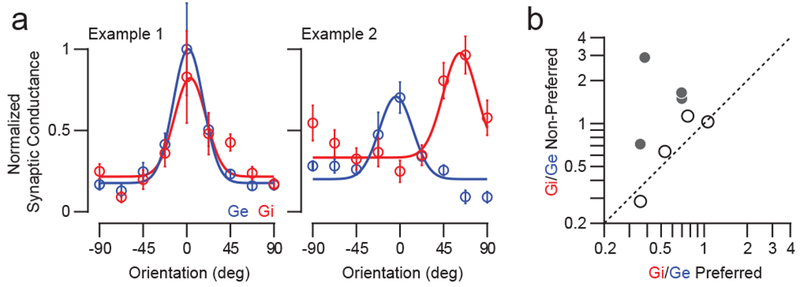
Understanding how cortical inhibition shapes circuit function requires identifying the connectivity rules relating the response properties of inhibitory interneurons and their postsynaptic targets. Here we explore the orientation tuning of layer 2/3 inhibitory inputs in the ferret visual cortex using a combination of in vivo axon imaging, functional input mapping, and physiology. Inhibitory boutons exhibit robust orientation-tuned responses with preferences that can differ significantly from the cortical column in which they reside. Inhibitory input fields measured with patterned optogenetic stimulation and intracellular recordings revealed that these inputs originate from a wide range of orientation domains, inconsistent with a model of co-tuned inhibition and excitation. Intracellular synaptic conductance measurements confirm that individual neurons can depart from a co-tuned regime. Our results argue against a simple rule for the arrangement of inhibitory inputs supplied by layer 2/3 circuits and suggest that heterogeneity in presynaptic inhibitory networks contributes to neural response properties.


Conflict of interest statement

Competing financial interests

The authors declare no competing financial interests.

Figures

Figure 1.
Figure 1.. GABAergic axonal boutons exhibit a diverse arrangement of orientation preferences.
(a) Epifluorescence image of injection site (dashed line) with an axon imaging site highlighted (white box). (b) Intrinsic signal polar orientation map for cortical region in (a). (c) Example two-photon projection for site in (a). Visually-responsive and selective (OSI > 0.15) boutons are labeled and pseudocolored based on orientation preferences. (d) Example intrinsic signal polar orientation map for the same two-photon site. (e) Example orientation tuning of axonal boutons. Data are mean and standard error. Gaussian tuning curves are least-squared fits. (f) Distribution of OSI across all visually-responsive boutons. (g) Distribution of bouton orientation preference difference relative to corresponding local cortical region. (h) Axon imaging sites with respect to the injection site (dashed line). (i) Pixel-based polar orientation map from two-photon imaging of mDlx-GCaMP6s labeled GABAergic boutons (depth = 17 μm) at the ROI indicated in (h). (j) Spatially-smoothed pixel-based polar orientation map for hSyn-jRGECO1a activity (depth = 235 μm) in the same ROI. (k) Example orientation tuning of axonal bouton. Data are mean and standard error. Gaussian tuning curves are least-squared fits. (l) Orientation preference distributions for and corresponding local hSyn-jRGECO1a signal at the ROI indicated in (h). (m) Distribution of orientation preference difference between boutons and local hSyn-jRGECO1a signal. Shown are boutons with OSI > 0.15.
Figure 2.
Figure 2.. Somatic-targeted optogenetic membrane potential mapping of functional connectivity.
(a) Example whole-cell patch clamp recording of complex cell in layer 2/3 of ferret visual cortex. Shown are spiking (gray, top) and subthreshold Vm (black, bottom) responses to oriented gratings. (b) Image of optogenetic stimulation grid over the cortical surface with visible intracellular pipette. (c) Mean inhibitory postsynaptic potential (IPSP) waveforms evoked by sampled spots in (b) for the cell in (a). (d) Intrinsic orientation preference map for the cortical region overlapping with the IPSP map shown in (c). (e) Vm orientation tuning and IPSP weight for cell in (a). IPSP weight calculated as the average inhibitory input, normalized by IPSP amplitude, relative to spot location in the orientation intrinsic map. Orientation preferences are aligned to the Vm preference. Orientation tuning data points are peak Vm responses. All data shown are mean and standard error. (f-g) Same as in (e) for two example cells and corresponding inhibitory input fields.
Figure 3.
Figure 3.. Layer 2/3 inhibitory input fields are broadly tuned for orientation.
(a) Average Vm tuning and IPSP weight for cells with weak orientation selectivity (left) or with moderate to high selectivity (right). Data are mean and standard error. (b) Same as in (a) for stimulated spots less than 300 μm from the recording pipette. (c) Same as in (a) for stimulated spots greater than 300 μm from the recording pipette.
Figure 4.
Figure 4.. Comparison of inhibitory and excitatory conductance orientation tuning.
(a) Orientation tuning of synaptic conductance from two example cells. Shown are peak responses of inhibition (Gi, red) and excitation (Ge, blue). Data are mean and standard error. Gaussian tuning curves are least-squared fits. (b) Comparison of Gi/Ge for preferred and non-preferred orientations. Filled circles: Cells with significantly different Gi/Ge ratios.

References

    1. Adesnik H, 2017. Synaptic Mechanisms of Feature Coding in the Visual Cortex of Awake Mice. Neuron 95, 1147–1159. e4. doi:10.1016/j.neuron.2017.08.014 - DOI - PMC - PubMed
    1. Anderson JS, Carandini M, Ferster D, 2000. Orientation tuning of input conductance, excitation, and inhibition in cat primary visual cortex. J Neurophysiol 84, 909–926. doi:10.1152/jn.2000.84.2.909 - DOI - PubMed
    1. Baker CA, Elyada YM, Parra A, Bolton MM, 2016. Cellular resolution circuit mapping with temporal-focused excitation of soma-targeted channelrhodopsin. Elife 5. doi:10.7554/eLife.14193 - DOI - PMC - PubMed
    1. Ben-Yishai R, Bar-Or RL, Sompolinsky H, 1995. Theory of orientation tuning in visual cortex. Proc Natl Acad Sci USA 92, 3844–3848. - PMC - PubMed
    1. Bortone DS, Olsen SR, Scanziani M, 2014. Translaminar inhibitory cells recruited by layer 6 corticothalamic neurons suppress visual cortex. Neuron 82, 474–485. doi:10.1016/j.neuron.2014.02.021 - DOI - PMC - PubMed

Publication types