Comment
. 2019 Nov 5;30(5):976-986.e3.
doi: 10.1016/j.cmet.2019.08.009. Epub 2019 Sep 5.

Gut-Proglucagon-Derived Peptides Are Essential for Regulating Glucose Homeostasis in Mice

Affiliations
Comment

Gut-Proglucagon-Derived Peptides Are Essential for Regulating Glucose Homeostasis in Mice

Youngmi Song et al. Cell Metab. .

Abstract

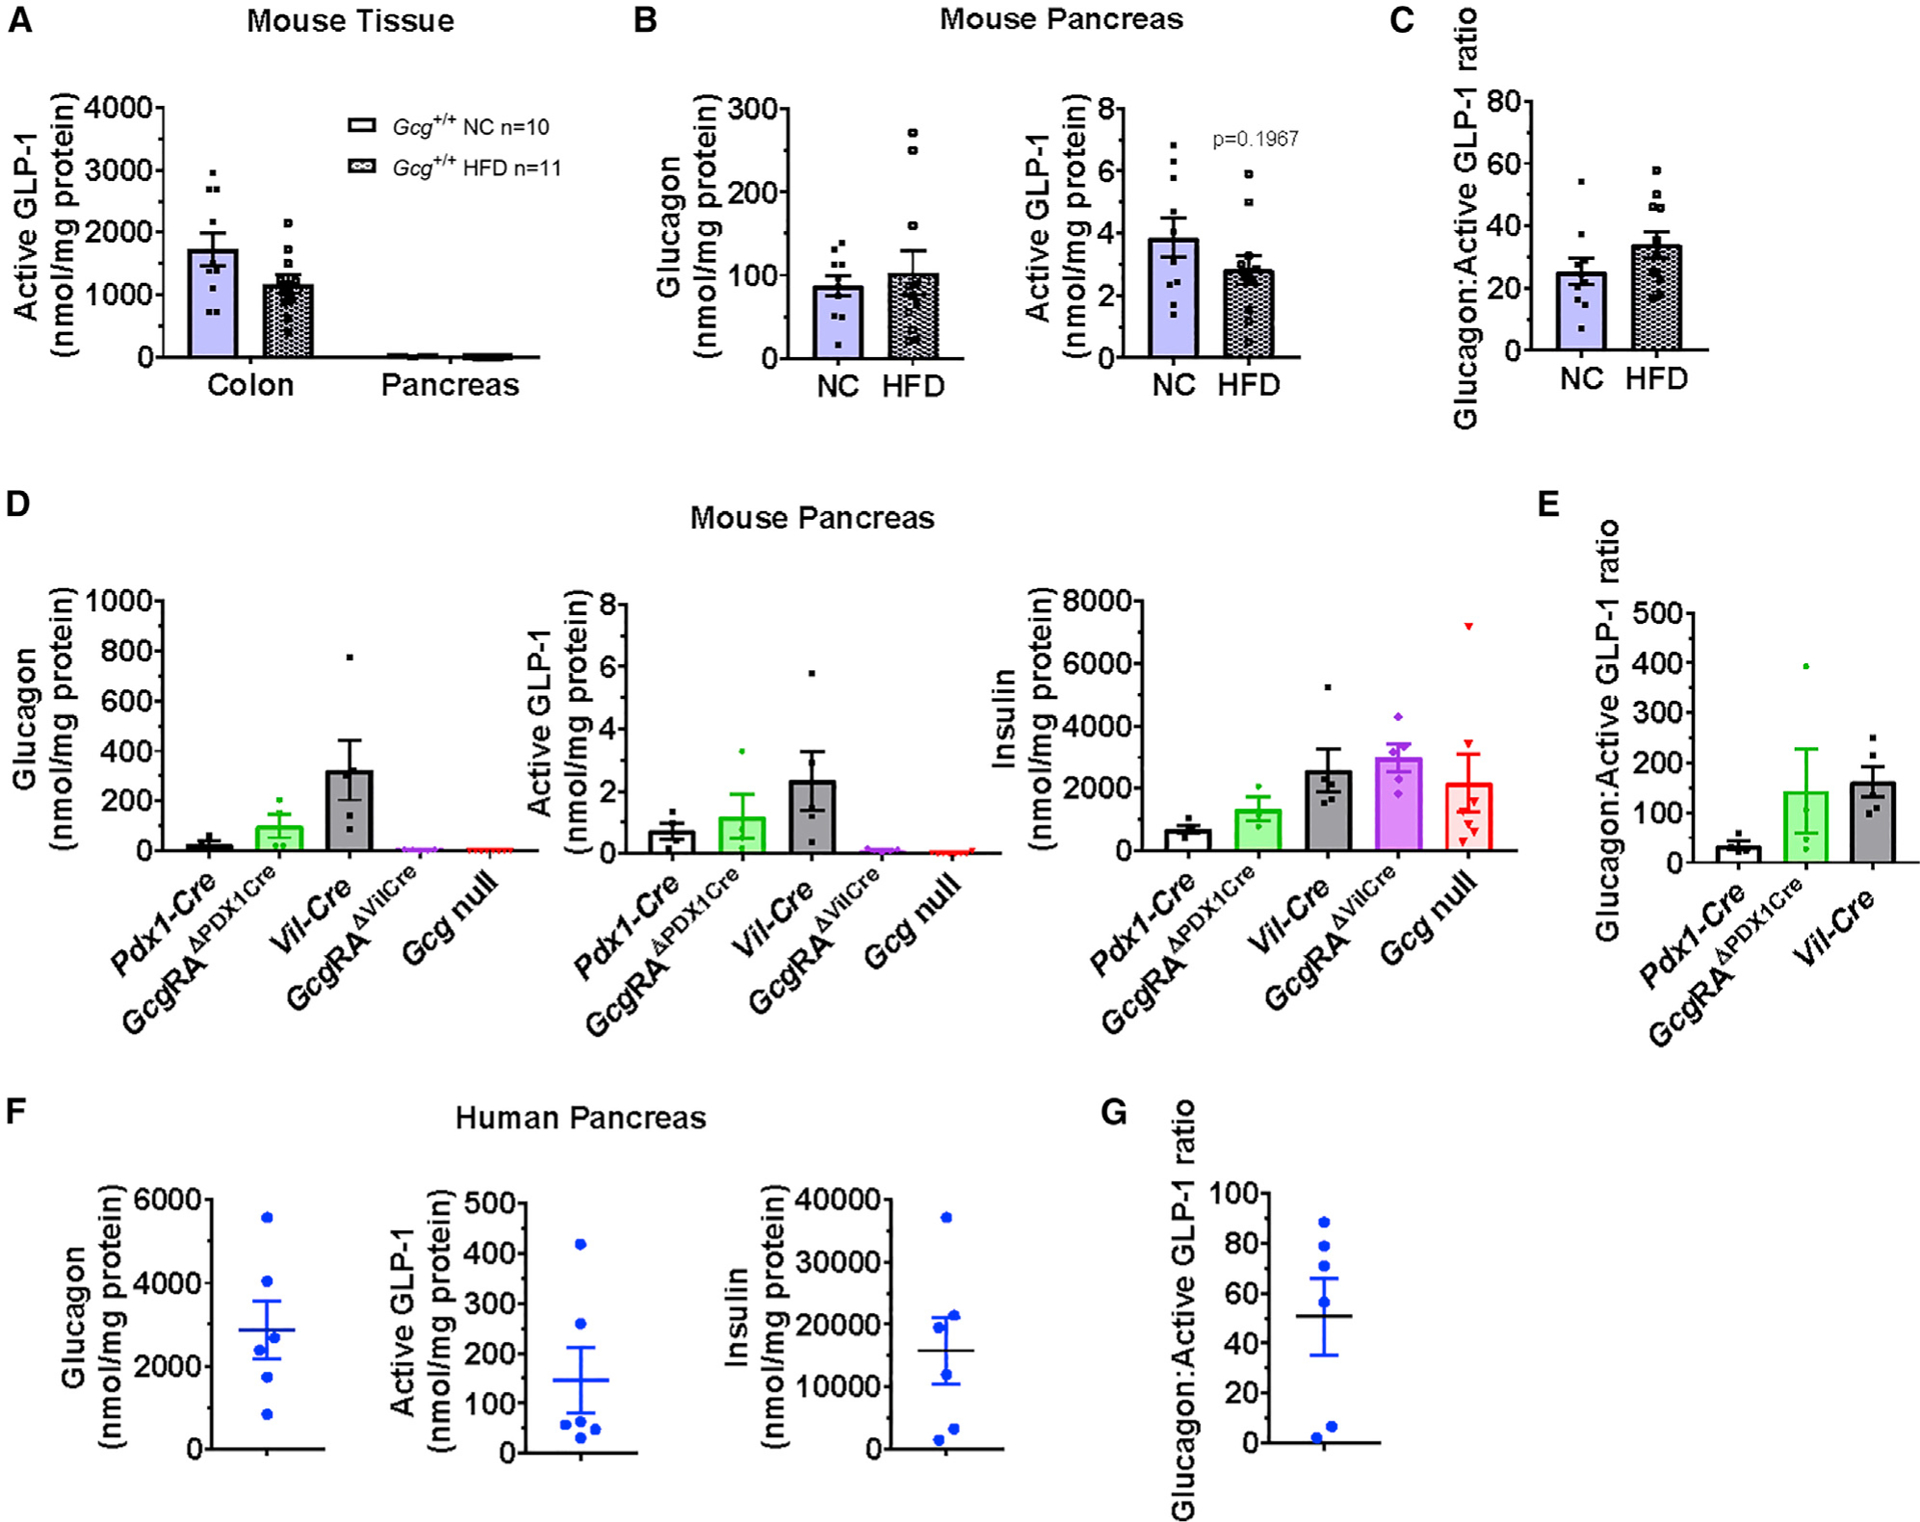
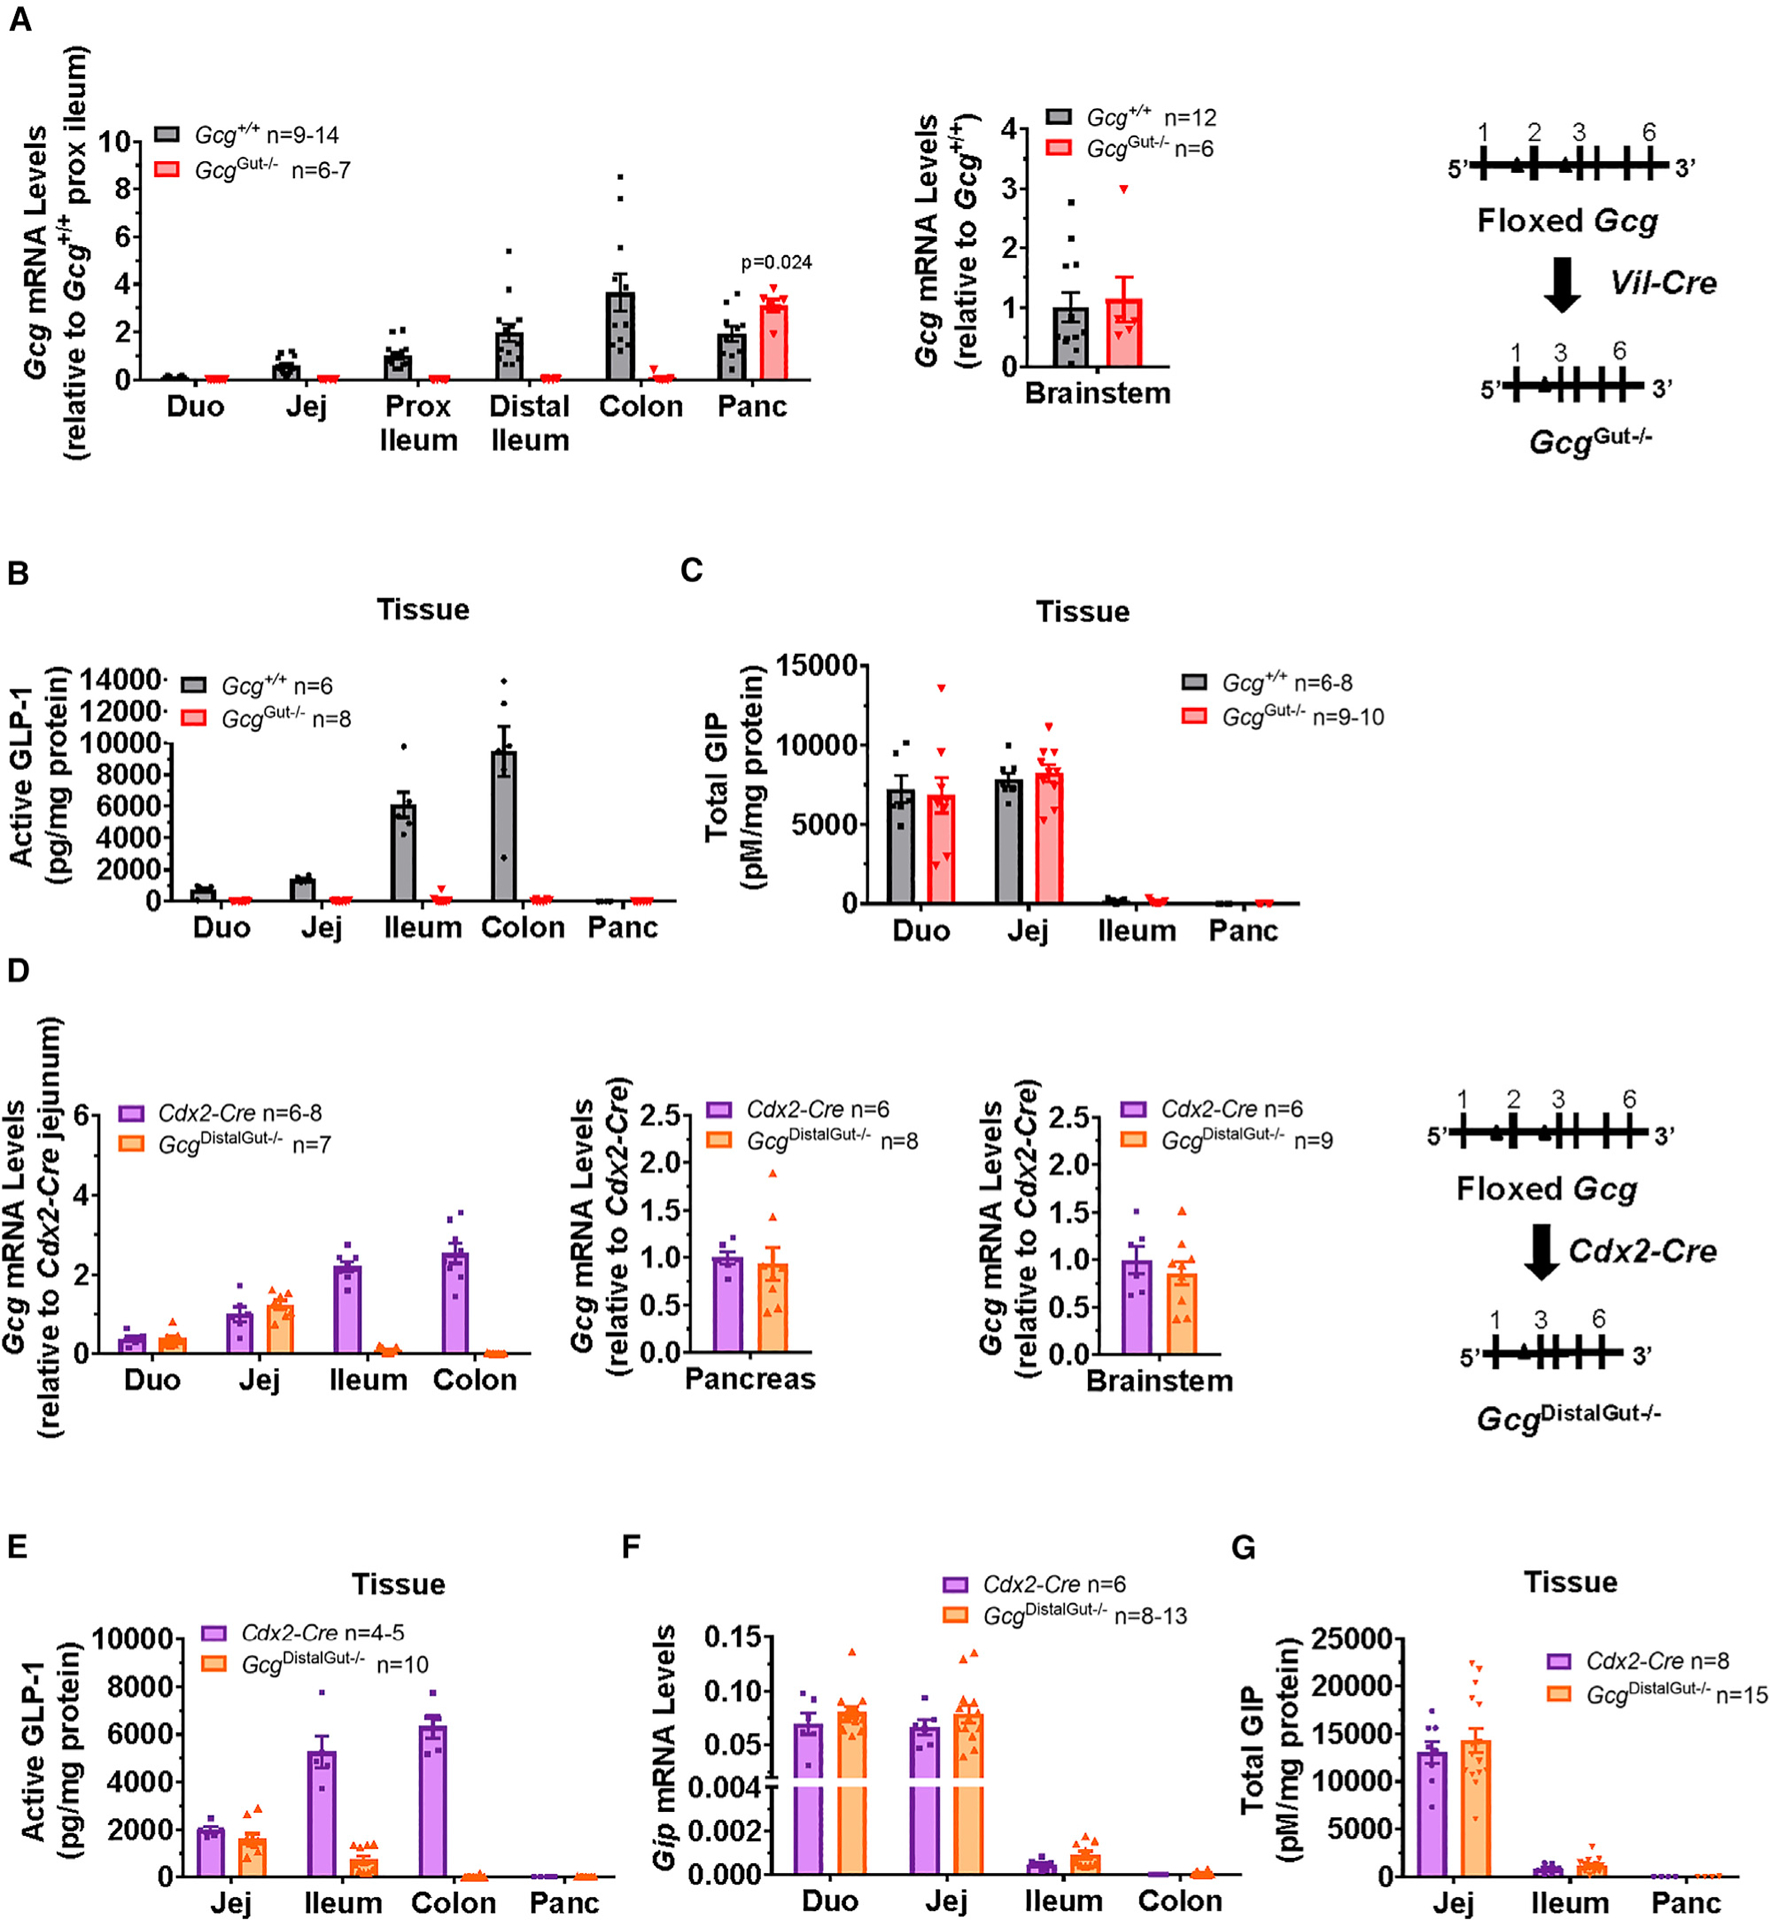
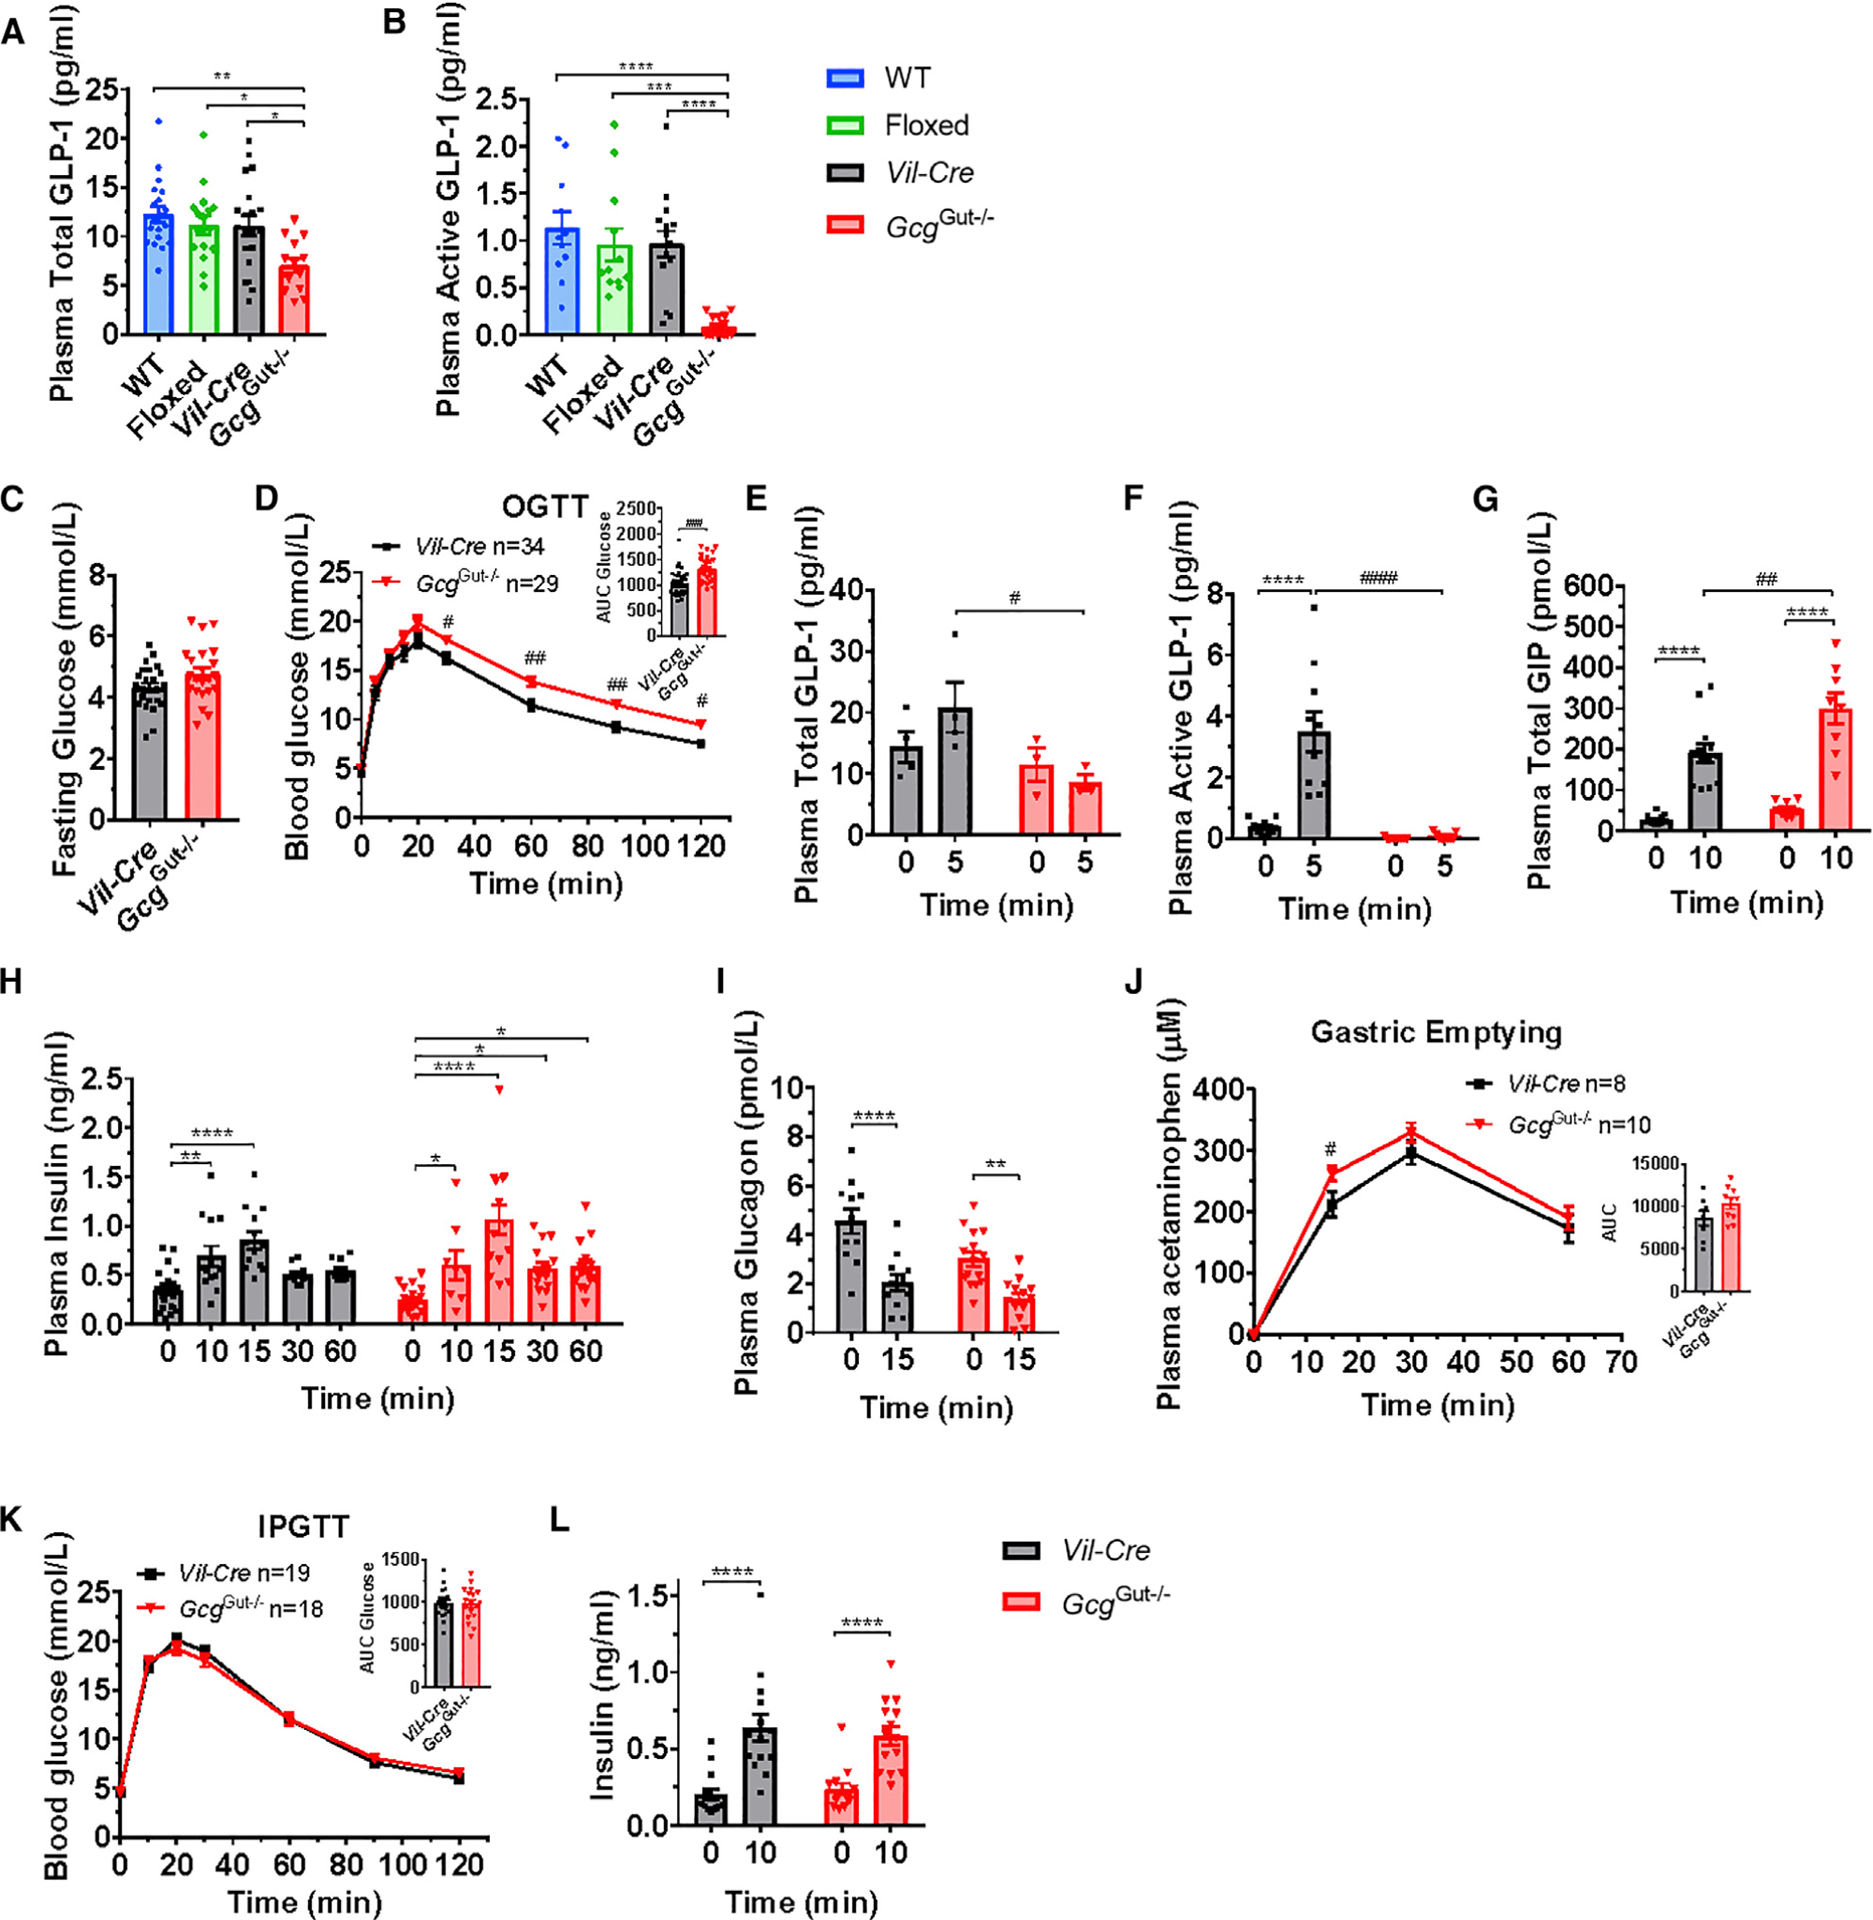
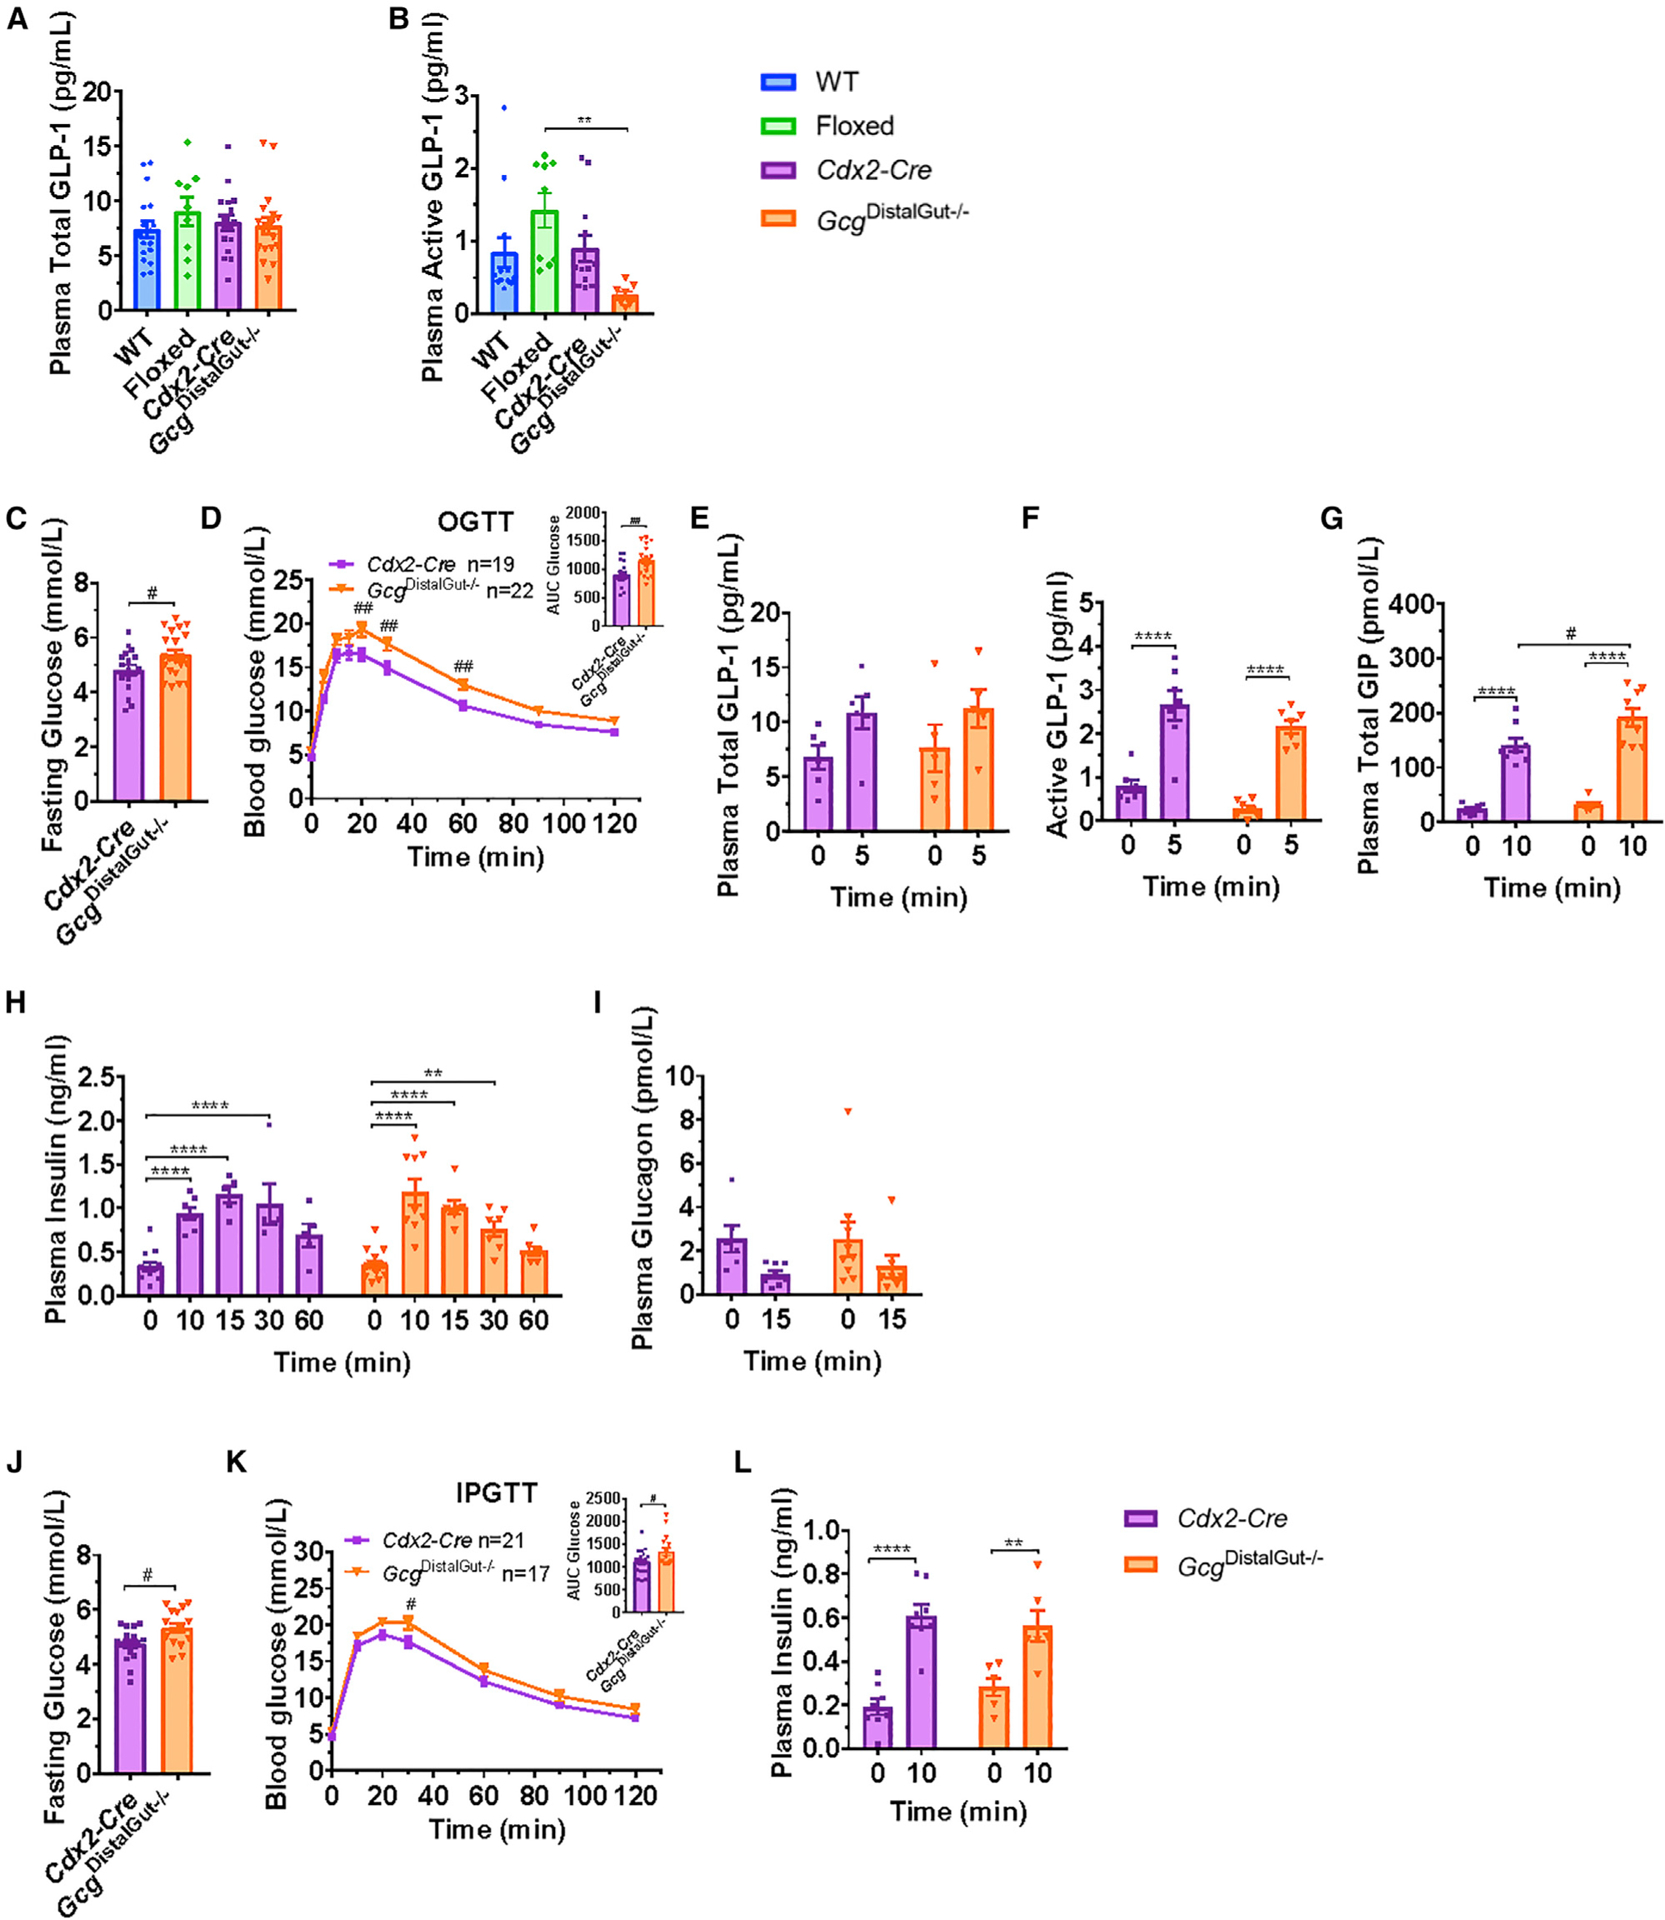
The importance of pancreatic versus intestinal-derived GLP-1 for glucose homeostasis is controversial. We detected active GLP-1 in the mouse and human pancreas, albeit at extremely low levels relative to glucagon. Accordingly, to elucidate the metabolic importance of intestinal proglucagon-derived peptides (PGDPs), we generated mice with reduction of Gcg expression within the distal (GcgDistalGut-/-) or entire (GcgGut-/-) gut. Substantial reduction of gut Gcg expression markedly reduced circulating levels of GLP-1, and impaired glucose homeostasis, associated with increased levels of GIP, and accelerated gastric emptying. GcgDistalGut-/- mice similarly exhibited lower circulating GLP-1 and impaired oral glucose tolerance. Nevertheless, plasma levels of insulin remained normal following glucose administration in the absence of gut-derived GLP-1. Collectively, our findings identify the essential importance of gut-derived PGDPs for maintaining levels of circulating GLP-1, control of gastric emptying, and glucose homeostasis.

Keywords: GIP; GLP-1; diabetes; enteroendocrine cell; glucagon; incretin; insulin; intestine; islet; pancreas.


Conflict of interest statement

DECLARATION OF INTERESTS

D.J.D. has served as an advisor, consultant, or speaker in the past 12 months to Forkhead Biotherapeutics, Heliome, Inc., Intarcia Therapeutics, Kallyope, Eli Lilly, Merck Research Laboratories, Novo Nordisk, Inc., Pfizer, Inc., and Sanofi, Inc. Neither D.J.D. nor his family members hold stock directly or indirectly in any of these companies.

Figures

Figure 1.
Figure 1.. Assessment of Peptide Content in Mouse and Human Pancreas
(A and B) Comparison of active GLP-1 tissue levels in colon versus pancreas (A), or glucagon (left panel) and active GLP-1 tissue levels (right panel) in pancreas (B), normalized to protein content, in tissue extracts from 18-to 21-week-old WT (Gcg+/+) male mice fed normal chow (NC) or a 60% high-fat diet (HFD) for 7 weeks. (C) Abundance of glucagon relative to active GLP-1 (glucagon-active GLP-1 ratio) in pancreas of NC or HFD-fed mice (n = 10–11). (D and E) Tissue levels of (D) glucagon, active GLP-1, and insulin in extracts from pancreas, normalized to protein content, and (E) relative glucagon to active GLP-1 tissue levels in pancreas of 28-week-old male Cre controls, Gcg-null, and pancreas-(GcgRAΔPDX1Cre) or intestinal-reactivated (GcgRAΔVilCre) mice (n = 4–5/group). For (E), glucagon:active GLP-1 ratios are not reported for GcgRAΔVilCre or Gcg-null mice, as glucagon and/or active GLP-1 levels were below detectable limits of the assays. (F and G) Tissue levels of (F) glucagon, active GLP-1, and insulin in extracts from normal human pancreas, normalized to protein content, and (G) glucagon-active GLP-1 ratio in human pancreas samples (n = 6). See also Figure S1 and Table S1.
Figure 2.
Figure 2.. Characterization of GcgGut–/– and GcgDistalGut–/– Mice
(A) Proglucagon (Gcg) mRNA abundance normalized to levels of mRNA for ribosomal protein L32 (Rpl32) in different regions of the small intestine, colon, and pancreas (left panel) or brainstem (right panel) of 16- to 18-week-old female mice by qPCR using a primer probe set against exons 1–2 of the Gcg gene (n = 6–14/group). Gene expression was expressed relative to values for Gcg mRNA transcripts in proximal ileum (prox ileum; left panel), or brainstem (right panel) of control Gcg+/+ mice. (B and C) Active GLP-1 (B) and total GIP levels (C), normalized to total protein content, in whole-tissue extracts from different regions of the intestine and pancreas of 16- to 18-week-old female mice (n = 6–8/group for GLP-1, n = 6–10 for GIP). Duo, duodenum; Jej, jejunum; Prox ileum, proximal ileum; Panc, pancreas. Gcg+/+ mice represent combined data from WT, Gcgflox/flox, and Vil-Cre control mice. (D) Gcg mRNA abundance normalized to cyclophilin (Ppia) in different regions of the small intestine and colon (left panel), pancreas (middle panel), or brainstem (right panel) of 20- to 23-week-old male mice by qPCR (n = 6–9/group). Gene expression was expressed relative to Gcg mRNA levels in control (Cdx2-Cre) mice. (E) Active GLP-1 levels, normalized to total protein content, in whole-tissue extracts from different regions of the intestine and pancreas of 20- to 23-week-old male mice (n = 4–10/group). (F) Gip mRNA abundance normalized to cyclophillin (Ppia) from different regions of the small intestine and colon of 20- to 23-week-old male mice (n = 6–13/group). (G) Total GIP levels, normalized to total protein content, in whole-tissue extracts from the small intestine of 20- to 23-week-old male mice (n = 8–15/group). See also Figures S2 and S3.
Figure 3.
Figure 3.. Loss of Gut Gcg Expression Produces Glucose Intolerance Following Oral, but not i.p., Glucose Administration
(A and B) Fasting plasma levels of (A) total GLP-1 or (B) active GLP-1 in overnight fasted 10- to 17-week-old male GcgGut−/− and control mice (n = 11–19/group). (C and D) Fasting blood glucose levels (C) and blood glucose levels (D) 0–120 min after oral glucose (OGTT, 1.5g/kg) and area under the curve (AUC, inset) for glucose excursions in overnight fasted 12- to 17-week-old male GcgGut−/− and Vil-Cre control mice (n = 29–34/group). (E–I) Plasma total GLP-1 (E), active GLP-1 (F), total GIP (G), insulin (H), and glucagon (I) measured before and 5–60 min after oral glucose challenge, as indicated (n = 4–15/group). (J) Plasma acetaminophen levels, as a measurement of gastric emptying, 0–60 min after co-administration of oral acetaminophen and glucose (n = 8–10/group). (K) Blood glucose levels before and after i.p. administration of glucose (IPGTT, 1.5 g/kg) and AUC (inset) for i.p. glucose excursions in overnight fasted 14- to 19-week-old male GcgGut−/− and Vil-Cre control mice (n = 19–18/group). (L) Plasma insulin measured before and 10 min after an intraperitoneal glucose challenge (n = 14/group). Data are presented as the mean ± SEM. (A and B) *p < 0.05, **p < 0.01, ***p < 0.001, ****p < 0.0001, control versus GcgGut−/− mice. (D–L) *p < 0.05, **p < 0.01, ****p < 0.0001, 0 versus 5–60 min. #p < 0.05, ##p<0.01, ###p < 0.001, ####p < 0.0001, GcgGut−/− versus Vil-Cre mice. See also Figures S2 and S4.
Figure 4.
Figure 4.. GcgDistalGut–/– Mice Exhibit Impaired Glucose Tolerance
(A and B) Fasting plasma levels of (A) total GLP-1 or (B) active GLP-1 in overnight fasted 10- to 14-week-old male GcgDistalGut−/− and control mice (n = 7–17/group). (C and D) Fasting glucose (C) blood glucose levels (D) after oral glucose (OGTT, 1.5 g/kg) and area under the curve (AUC, inset) for glucose excursions in overnight fasted 12- to 15-week-old male GcgDistalGut−/− and Cdx2-Cre control mice (n = 19–22/group). (E–I) Plasma total GLP-1 (E), active GLP-1 (F), total GIP (G), insulin (H), and glucagon (I) measured before and 5–60 min after oral glucose challenge as indicated (n = 5–9/group). (J and K) Fasting glucose levels (J) and blood glucose levels (K) following i.p. administration of glucose (IPGTT, 1.5 g/kg) and AUC (inset) for i.p. glucose excursions in overnight fasted 14- to 17-week-old male GcgDistalGut−/− and Cdx2-Cre control mice. (L) Plasma insulin before and 10 min after an i.p. glucose challenge. For (J) and (K), n = 17–21/group and for (L), n = 6–8/group. Data are presented as the mean ± SEM. (B) **p < 0.01, control versus GcgDistalGut−/− mice. (C–L) **p < 0.01, ****p < 0.0001, 0 versus 5–60 min. #p < 0.05, ##p < 0.01, GcgDistalGut−/− versus Cdx2-Cre mice. See also Figures S3 and S4.

Comment on

  • The Role of Pancreatic Preproglucagon in Glucose Homeostasis in Mice.
    Chambers AP, Sorrell JE, Haller A, Roelofs K, Hutch CR, Kim KS, Gutierrez-Aguilar R, Li B, Drucker DJ, D'Alessio DA, Seeley RJ, Sandoval DA. Chambers AP, et al. Cell Metab. 2017 Apr 4;25(4):927-934.e3. doi: 10.1016/j.cmet.2017.02.008. Epub 2017 Mar 16. Cell Metab. 2017. PMID: 28325479 Free PMC article.

References

    1. Brissova M, Haliyur R, Saunders D, Shrestha S, Dai C, Blodgett DM, Bottino R, Campbell-Thompson M, Aramandla R, Poffenberger G, et al. (2018). Alpha cell function and gene expression are compromised in type 1 diabetes. Cell Rep 22, 2667–2676. - PMC - PubMed
    1. Campbell JE, and Drucker DJ (2013). Pharmacology physiology and mechanisms of incretin hormone action. Cell Metab 17, 819–837. - PubMed
    1. Capozzi ME, Svendsen B, Encisco SE, Lewandowski SL, Martin MD, Lin H, Jaffe JL, Coch RW, Haldeman JM, MacDonald PE, et al. (2019a). Beta cell tone is defined by proglucagon peptides through cAMP signaling. JCI Insight 4. - PMC - PubMed
    1. Capozzi ME, Wait JB, Koech J, Gordon AN, Coch RW, Svendsen B, Finan B, D’Alessio DA, and Campbell JE (2019b). Glucagon lowers glycemia when beta-cells are active. JCI Insight 5. - PMC - PubMed
    1. Chambers AP, Sorrell JE, Haller A, Roelofs K, Hutch CR, Kim KS, Gutierrez-Aguilar R, Li B, Drucker DJ, D’Alessio DA, et al. (2017). The role of pancreatic preproglucagon in glucose homeostasis in mice. Cell Metab 25, 927–934.e3. - PMC - PubMed

LinkOut - more resources