. 2019 Oct 3;25(4):542-557.e9.
doi: 10.1016/j.stem.2019.08.004. Epub 2019 Sep 5.

Development of Hematopoietic Stem Cell-Engineered Invariant Natural Killer T Cell Therapy for Cancer

Affiliations

Development of Hematopoietic Stem Cell-Engineered Invariant Natural Killer T Cell Therapy for Cancer

Yanni Zhu et al. Cell Stem Cell. .

Abstract

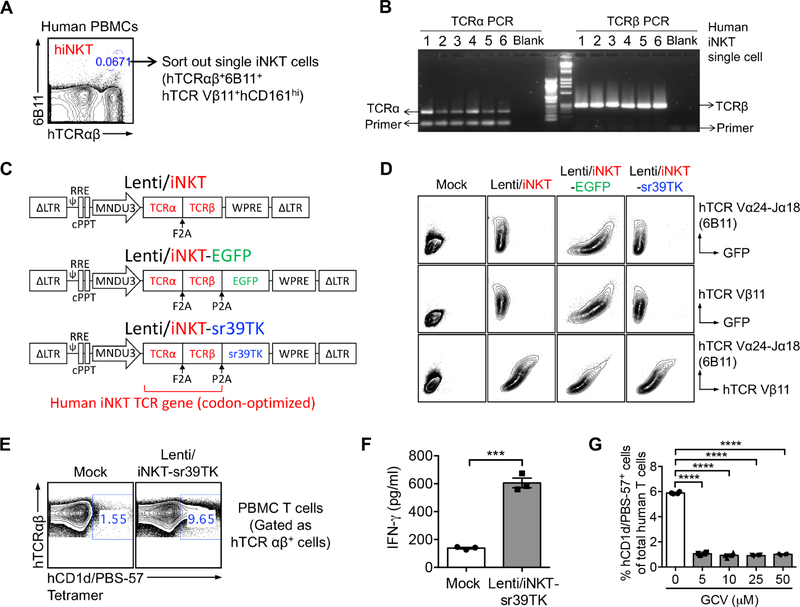
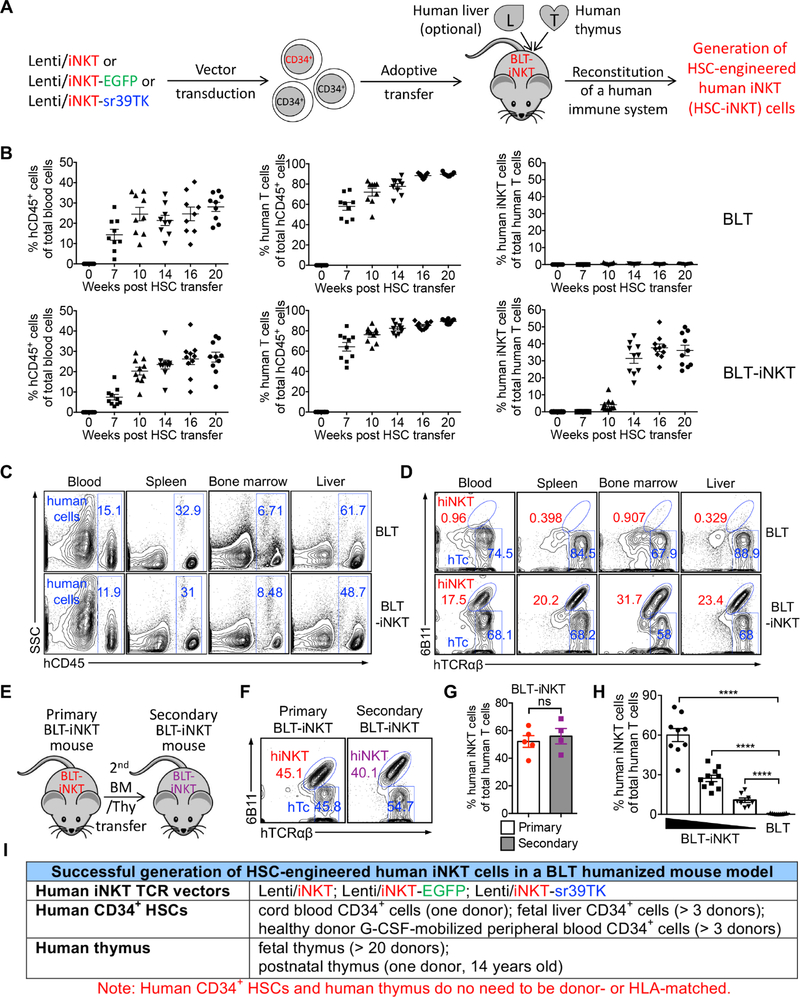
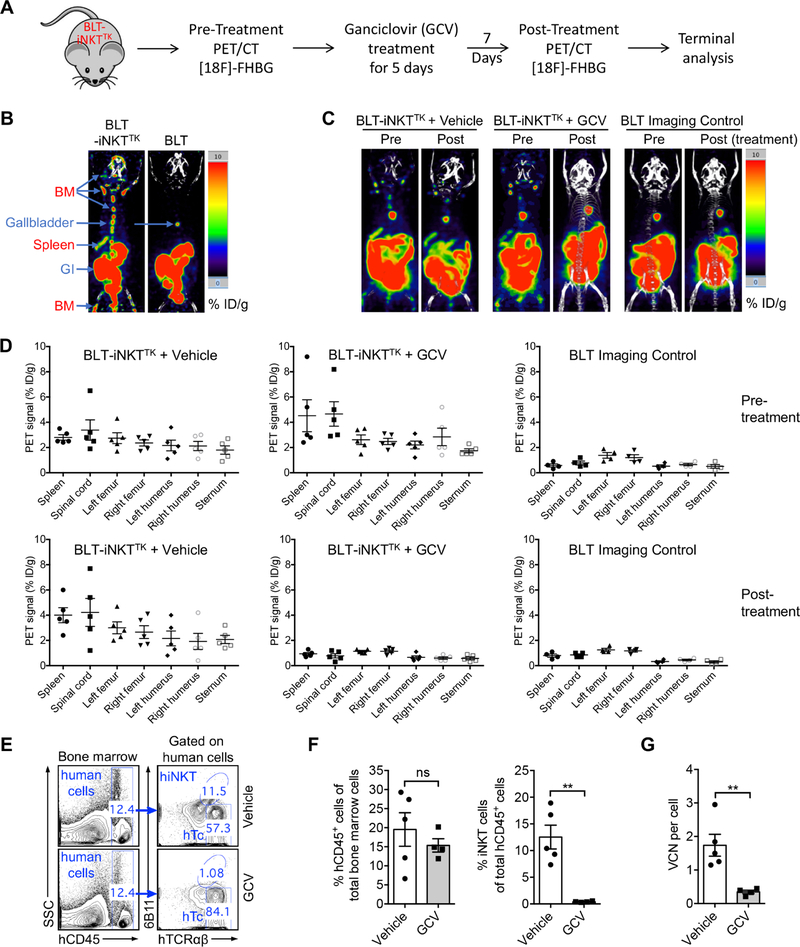
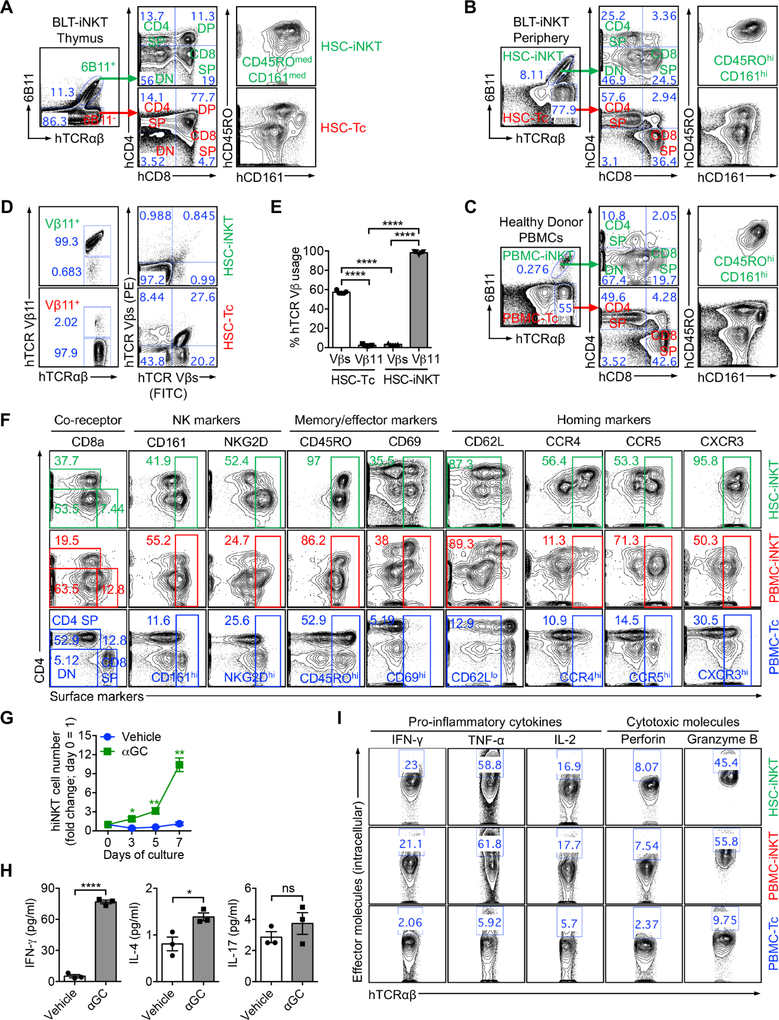
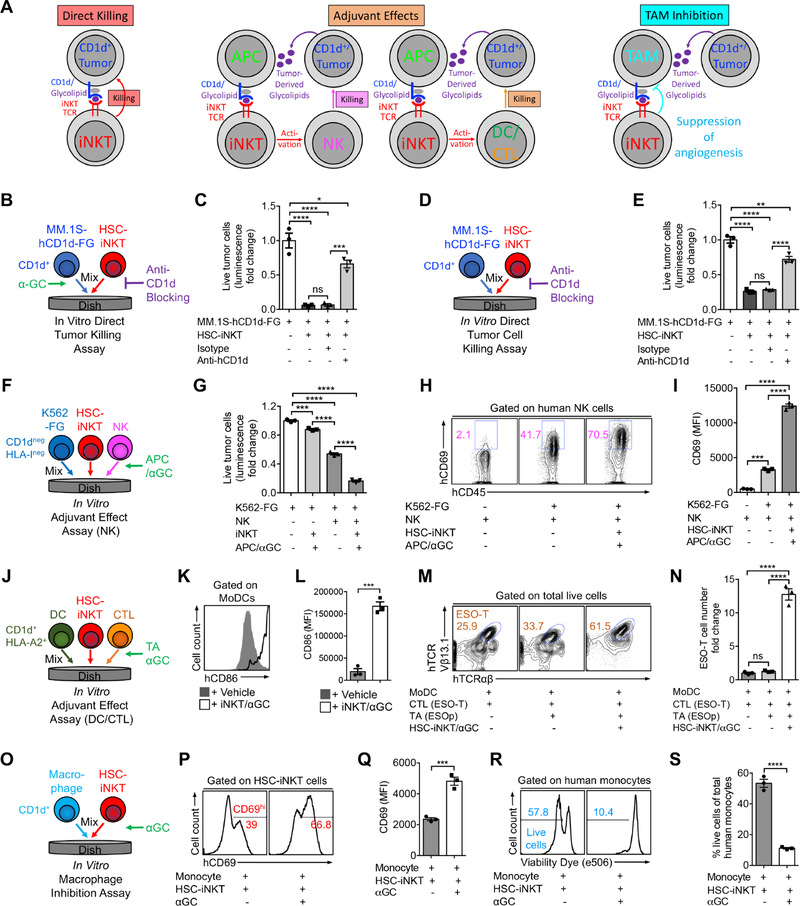
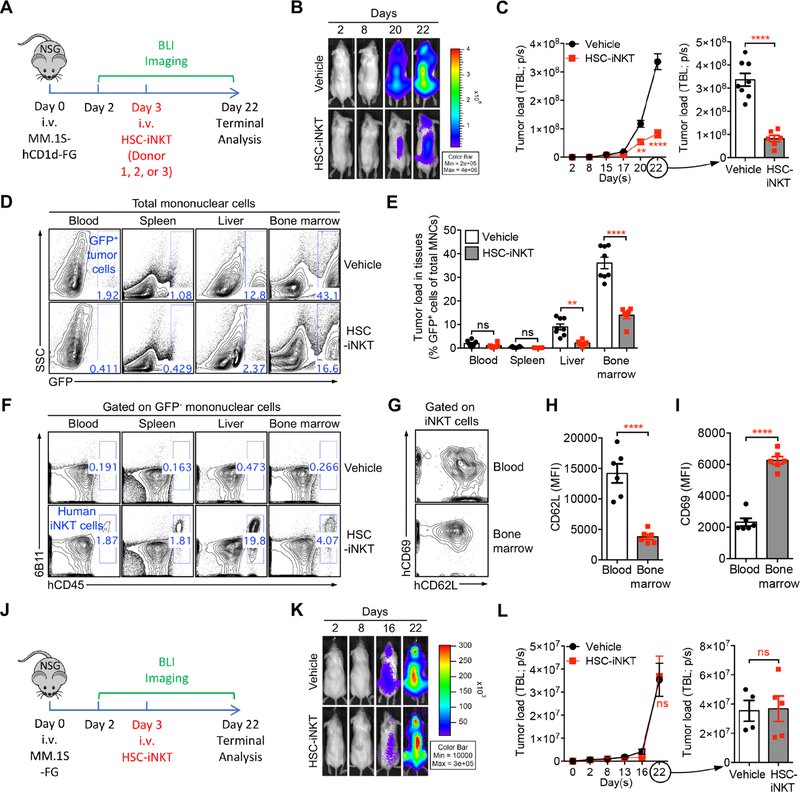
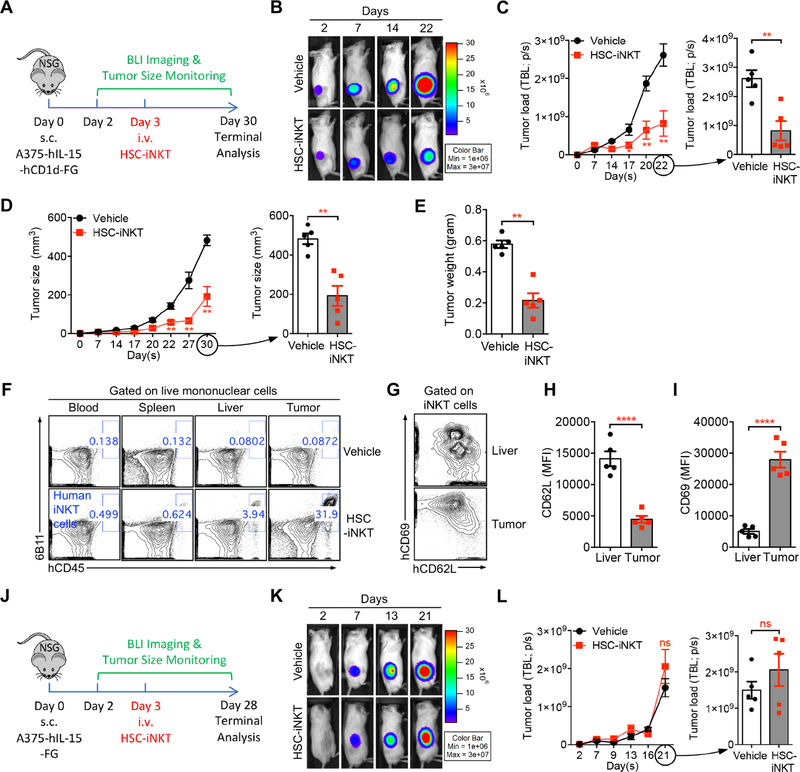
Invariant natural killer T (iNKT) cells are potent immune cells for targeting cancer; however, their clinical application has been hindered by their low numbers in cancer patients. Here, we developed a proof-of-concept for hematopoietic stem cell-engineered iNKT (HSC-iNKT) cell therapy with the potential to provide therapeutic levels of iNKT cells for a patient's lifetime. Using a human HSC engrafted mouse model and a human iNKT TCR gene engineering approach, we demonstrated the efficient and long-term generation of HSC-iNKT cells in vivo. These HSC-iNKT cells closely resembled endogenous human iNKT cells, could deploy multiple mechanisms to attack tumor cells, and effectively suppressed tumor growth in vivo in multiple human tumor xenograft mouse models. Preclinical safety studies showed no toxicity or tumorigenicity of the HSC-iNKT cell therapy. Collectively, these results demonstrated the feasibility, safety, and cancer therapy potential of the proposed HSC-iNKT cell therapy and laid a foundation for future clinical development.

Keywords: HSC; HSC transfer; HSCT; T cell receptor; TCR; cancer immunotherapy; cell therapy; gene therapy; hematopoietic stem cell; iNKT; invariant natural killer T cell; preclinical development; sr39TK suicide gene; stem cell therapy.


Conflict of interest statement

DECLARATION OF INTERESTS

Y.Z., D.J.S, and L.Y. are inventors on patent(s) relating to this study filed by UCLA. D.J.S. and S.D.B. are currently employees of Kite, a Gilead Company. F.U. is currently an employee of PACT Pharma. S.H. is a consultant for Amgen and Merck. S.M.L. is on the speaker bureau for Takeda and is a consultant for Bristol-Meyers Squibb. J.R.H is a founder and board member of Isoplexis and PACT Pharma. C.G.R. is a founder and stockholder of Sofie Biosciences and Trethera Corporation. A.R. is a consultant for Amgen, Bristol-Meyers Squibb, Chugai, Genentech-Roche, Merck-MSD, Novartis, and Sanofi; a scientific advisory board member and stockholder for Advaxis, Apricity, Arcus, Bioncotech, Compugen, CytomX, Five Prime, FLX-Bio, ImaginAb, Isoplexis, Kite-Gilead, Merus, and Rgenix; and a co-founder and scientific advisory board member of Lutris, PACT Pharma, and Tango therapeutics. D.B.K. is an inventor on intellectual property licensed by UCLA to Orchard Therapeutics and is a member of their Scientific Advisory Board; D.B.K. is also a scientific advisory board member of Allogene Therapeutics. O.N.W. is a consultant, stockholder, and/or board member with Trethera Corporation, Kronos Biosciences, Sofie Biosciences, and Allogene Therapeutics. All other authors declare no competing interests. None of the declared companies contributed to or directed any of the research reported in this article.

Figures

Figure 1.
Figure 1.. Cloning of Human Invariant Natural Killer T Cell Receptor (iNKT TCR) Genes and Construction of Lentiviral Gene Delivery Vectors.
(A-B) Cloning of human iNKT TCR genes using a single-cell RT-PCR approach. (A) FACS sorting of single human iNKT cells. (B) Representative DNA gel image showing the human TCR α and β chain PCR products from six sorted single iNKT cells. (C) Schematics of the Lenti/iNKT, Lenti/iNKT-EGFP, and Lenti/iNKT-sr39TK vectors. (D) FACS detection of intracellular expression of iNKT TCRs (identified as hTCR Vβb11+6B11+) in 293T cells transduced with the indicated iNKT TCR gene delivery lentivectors. (E-G) Functional characterization of the Lenti/iNKT-sr39TK vector by transducing human PBMC T cells. (E) FACS detection of surface iNKT TCR expression on vector-transduced PBMC T cells. (F) ELISA analysis of IFN-γ production by vector-transduced PBMC T cells post-αGC stimulation (n = 3). (G) FACS quantification of the depletion of vector-transduced PBMC T cells post-GCV treatment (n = 4). Representative of 2 experiments. See also Figure S1.
Figure 2.
Figure 2.. Generation of Hematopoietic Stem Cell-Engineered Human iNKT (HSC-iNKT) Cells in BLT-iNKT Humanized Mice.
(A) Experimental design to generate HSC-iNKT cells in a BLT humanized mouse model. (B-D) Generation of HSC-iNKT cells in BLT-iNKT mice. (B) Time-course FACS monitoring of human immune cells (gated as hCD45+ cells), human αβ T cells (gated as hCD45+hTCRαβ+ cells), and human iNKT cells (gated as hCD45+hTCRαβ+6B11+ cells) in the peripheral blood of BLT-iNKT mice and control BLT mice post-HSC transfer (n = 9–10). (C) FACS detection of human immune cells in various tissues of BLT-iNKT and control BLT mice, at week 20 post-HSC transfer. (D) FACS detection of HSC-iNKT cells in various tissues of BLT-iNKT mice, at week 20 post-HSC transfer. hiNKT, human iNKT cells; hTc, conventional human αβ T cells (gated as hCD45+hTCRαβ+6B11 cells). (E-G) Long-term production of HSC-iNKT cells in BLT-iNKT mice. (E) Experimental design. BM, total bone marrow cells harvested from the primary BLT-iNKT mice; Thy, human thymus implants collected from the primary BLT-iNKT mice. (F) FACS detection of HSC-iNKT cells in the peripheral blood of the secondary BLT-iNKT mice at week 16 after the secondary BM/Thy transfer. (G) Quantification of F (n = 4–5). (H) Controlled production of HSC-iNKT cells in BLT-iNKT mice. BLT-iNKT mice were generated with PBSCs transduced with titrated amounts of Lenti/iNKT-sr39TK vector (4 × 10⁸, 2 × 10⁸, or 1 × 10⁸ TU per 1 × 10⁶ PBSCs). FACS quantification of human iNKT cells in the blood of indicated BLT-iNKT mice at week 16 post-HSC transfer were presented (n = 8–10). (I) Table summarizing experiments that have successfully generated HSC-iNKT cells in the BLT human mouse model. Representative of 2 (E-G, H) and over 10 (B-D) experiments.
Figure 3.
Figure 3.. Biodistribution and Controlled Depletion of HSC-iNKT Cells in BLT-iNKT Humanized Mice Visualized by PET Imaging.
(A) Experimental design. BLT-iNKTTK, BLT-iNKT mice generated with Lenti/iNKT-sr39TK vector-transduced PBSCs. (B) Biodistribution of vector-engineered human immune cells. Representative PET/CT images were presented. Note that there were background signals in the gastrointestinal tract (GI) and gallbladder of all mice. BM, bone marrow. (C-D) PET/CT analysis of controlled depletion of vector-engineered human immune cells in BLT-iNKTTK mice via GCV treatment. (C) Representative PET/CT images. (D) Quantification of C (n = 4–5). (E-F) FACS validation of controlled depletion of HSC-iNKT cells in BLT-iNKTTK mice via GCV treatment. (E) Representative FACS plots of bone marrow cells. (F) Quantification of E (n = 4–5). (G) Droplet Digital PCR (ddPCR) validation of controlled depletion of vector-engineered human immune cells in BLT-iNKTTK mice via GCV treatment (n = 4–5). VCN, vector copy number. Representative of 2 experiments. See also Figures S2 and S3.
Figure 4.
Figure 4.. Development, Phenotype, and Functionality of HSC-iNKT Cells.
(A-C) Development of HSC-iNKT cells. (A) FACS analysis of developing HSC-iNKT cells in the human thymus implants of BLT-iNKT mice. (B) FACS analysis of mature HSC-iNKT cells in the periphery (blood) of BLT-iNKT mice. (C) FACS analysis of control native human iNKT (PBMC-iNKT) cells in the blood of a representative healthy human donor. (D-E) Allelic exclusion of endogenous TCRs in HSC-iNKT cells. (D) FACS plots showing the TCR Vβ usage by HSC-iNKT cells and HSC-TC cells harvested from the liver of BLT-iNKT mice. hTCR Vβs (FITC) and hTCR Vβs (PE) staining antibodies collectively stained human TCR Vβ 1, 2, 3, 4, 5.1, 5.2, 5.3, 7.1, 7.2, 8, 9, 12, 13.1, 13.2, 13.6, 16, 17, 18, 20, 21.3, and 23. (E) Quantification of D (n = 5). (F) Phenotype of HSC-iNKT cells. FACS plots are presented, showing the surface markers of HSC-iNKT cells isolated from the spleen of BLT-iNKT mice, compared to those of endogenous human iNKT (PBMC-iNKT) and conventional αβ T (PBMC-Tc) cells isolated from healthy donor peripheral blood. (G-H) Antigen responses of HSC-iNKT cells. Spleen cells of BLT-iNKT mice were cultured in vitro in the presence or absence of αGC for 7 days. (G) FACS quantification of HSC-iNKT cell expansion over time (n = 3). (H) ELISA analysis of cytokine production at day 7 (n = 3). (I) Production of effector molecules by HSC-iNKT cells. BLT-iNKT mice spleen cells and healthy donor PBMCs were stimulated in vitro with αGC for 7 days. FACS plots are presented, showing the intracellular production of effector cytokines and cytotoxic molecules in HSC-iNKT cells compared to that in the PBMC-iNKT and PBMC-Tc cells. Representative of 2 experiments. See also Figure S4.
Figure 5.
Figure 5.. Tumor-Attacking Mechanisms of HSC-iNKT Cells.
(A) Diagram showing the possible mechanisms utilized by human iNKT cells to attack tumor cells. APC, antigen presenting cell; NK, natural killer cell; DC, dendritic cell; CTL, cytotoxic T lymphocyte; TAM, tumor-associated macrophage. (B-E) Studying the direct killing of CD1d+ tumor cells by HSC-iNKT cells (tumor:iNKT ratio 1:10). (B) Experimental design to study CD1d-dependent killing of MM.1S-hCD1d-FG cells in the presence of αGC. (C) Tumor killing data from B (n = 3). (D) Experimental design to study CD1d-dependent killing of MM.1S-hCD1d-FG cells in the absence of αGC. (E) Tumor killing data from D (n = 3). (F-I) Studying the adjuvant effects of HSC-iNKT cells on enhancing NK cell-mediated killing of tumor cells (tumor:NK:iNKT ratio 1:2:2). (F) Experimental design. (G) Tumor killing (n = 3). (H) FACS plots showing CD69 expression on NK cells. (I) Quantification of H (n = 3). (J-N) Studying the adjuvant effects of HSC-iNKT cells on boosting DC/CTL antitumor reactions (DC:CTL:iNKT ratio 1:1:1). (J) Experimental design. (K) FACS plots showing CD86 expression on MoDCs. (L) Quantification of K (n = 3). (M) FACS plots showing the detection of ESO-T cells in the mixed cell culture. (N) Quantification of M (n = 3). (O-S) Studying the inhibition of macrophages by HSC-iNKT cells (macrophage:iNKT ratio 1:1). Monocytes isolated from healthy donor PBMCs were studied. (O) Experimental design. (P) FACS plots showing CD69 expression on HSC-iNKT cells. (Q) Quantification of P (n = 3). (R) FACS plots showing the viability of monocytes. (S) Quantification of R (n = 3). Representative of 2 experiments. See also Figures S5 and S6.
Figure 6.
Figure 6.. In Vivo Antitumor Efficacy of HSC-iNKT Cells Against Hematologic Malignancies in a Human Multiple Myeloma (MM) Xenograft Mouse Model.
(A-I) In vivo antitumor efficacy of HSC-iNKT cells was studied using an MM.1S-hCD1d-FG human MM xenograft NSG mouse model. HSC-iNKT cells derived from PBSCs of three different donors were studied, to verify the robustness of the HSC-iNKT cell therapy. Data from one representative donor were presented. (A) Experimental design. BLI, live animal bioluminescence imaging. (B) BLI images showing tumor loads in experimental mice over time. (C) Quantification of B (n = 6–8). TBL, total body luminescence. (D) FACS plots showing the detection of tumor cells (gated as GFP+ cells) in various tissues of experimental mice. (E) Quantification of D (n = 6–8). MNCs, mononuclear cells. (F) FACS plots showing the detection of HSC-iNKT cells in various tissues of experimental mice. (G) FACS plots showing the expression of CD62L and CD69 on HSC-iNKT cells isolated from the blood and bone marrow of tumor-bearing mice. (H-I) Quantification of G (n = 6). (J-L) In vivo antitumor efficacy of HSC-iNKT cells was studied using a control MM.1S-FG human MM xenograft NSG mouse model. HSC-iNKT cells derived from PBSCs of a representative donor were studied. (J) Experimental design. (K) BLI images showing tumor loads in experimental mice over time. (L) Quantification of K (n = 4–5). Representative of 3 (A-I) and 2 (J-L) experiments.
Figure 7.
Figure 7.. In Vivo Antitumor Efficacy of HSC-iNKT Cells Against Solid Tumors in a Human Melanoma Xenograft Mouse Model.
(A-I) In vivo antitumor efficacy of HSC-iNKT cells was studied using an A375-hIL-15-hCD1d-FG human melanoma xenograft NSG mouse model. (A) Experimental design. (B) BLI images showing tumor loads in experimental mice over time. Note that beyond day 22, BLI signals were saturated and thus were not included for quantification. (C) Quantification of B (n = 5). (D) Measurements of tumor size over time (n = 5). (E) Measurements of tumor weight at the terminal harvest on day 30 (n = 5). (F) FACS plots showing the detection of HSC-iNKT cells in various tissues of experimental mice. (G) FACS plots showing the expression of CD62L and CD69 on HSC-iNKT cells isolated from the livers and tumors of tumor-bearing mice. (H-I) Quantification of G (n = 5). (J-L) In vivo antitumor efficacy of HSC-iNKT cells was studied using a control A375-hIL-15-FG human melanoma xenograft NSG mouse model. (J) Experimental design. (K) BLI images showing tumor loads in experimental mice over time. Note that beyond day 21, BLI signals were saturated and thus were not included for quantification. (L) Quantification of K (n = 5). Representative of 2 experiments. See also Figure S7.

Comment in

Similar articles

Cited by

References

    1. Baltimore D, Witte ON, Yang L, Economou J, and Ribas A (2010). Overcoming barriers to programming a therapeutic cellular immune response to fight melanoma. Pigment Cell Melanoma Res. 23, 288–289. - PubMed
    1. Bendelac A, Savage PB, and Teyton L (2007). The biology of NKT cells. Annu. Rev. Immunol 25, 297–336. - PubMed
    1. Berzins SP, Smyth MJ, and Baxter AG (2011). Presumed guilty: natural killer T cell defects and human disease. Nat. Rev. Immunol 11, 131–142. - PubMed
    1. Bethune MT, Li XH, Yu J, McLaughlin J, Cheng D, Mathis C, Moreno BH, Woods K, Knights AJ, Garcia-Diaz A, et al. (2018). Isolation and characterization of NY-ESO-1-specific T cell receptors restricted on various MHC molecules. Proc. Natl. Acad. Sci. USA 115, E10702–E10711. - PMC - PubMed
    1. Bettini ML, Bettini M, and Vignali DA (2012). T-cell receptor retrogenic mice: a rapid, flexible alternative to T-cell receptor transgenic mice. Immunology 136, 265–272. - PMC - PubMed

Publication types

Substances