. 2019 Nov 7;25(5):682-696.e8.
doi: 10.1016/j.stem.2019.08.003. Epub 2019 Sep 5.

Cohesin Members Stag1 and Stag2 Display Distinct Roles in Chromatin Accessibility and Topological Control of HSC Self-Renewal and Differentiation

Affiliations

Cohesin Members Stag1 and Stag2 Display Distinct Roles in Chromatin Accessibility and Topological Control of HSC Self-Renewal and Differentiation

Aaron D Viny et al. Cell Stem Cell. .

Abstract

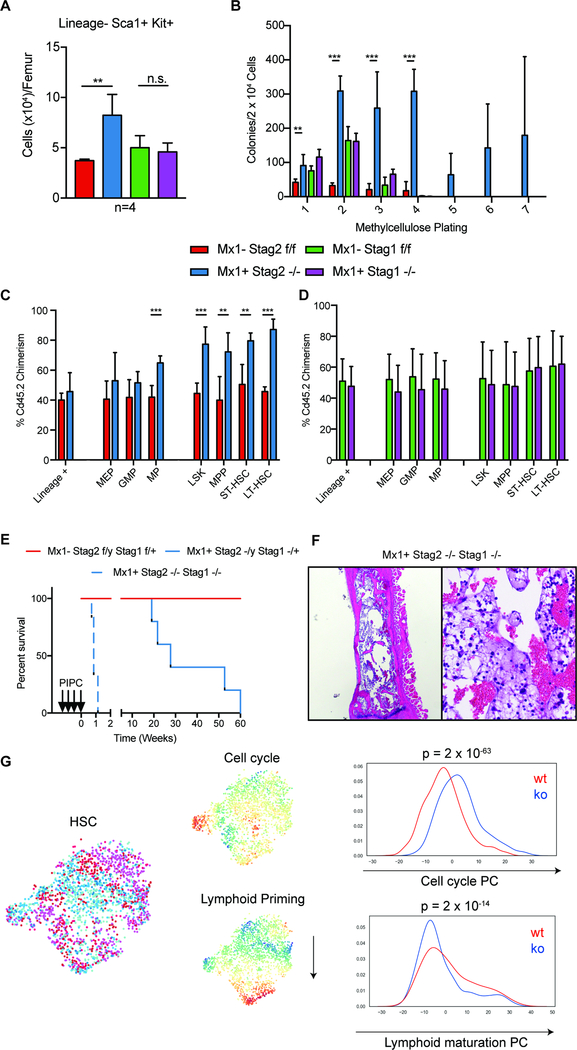
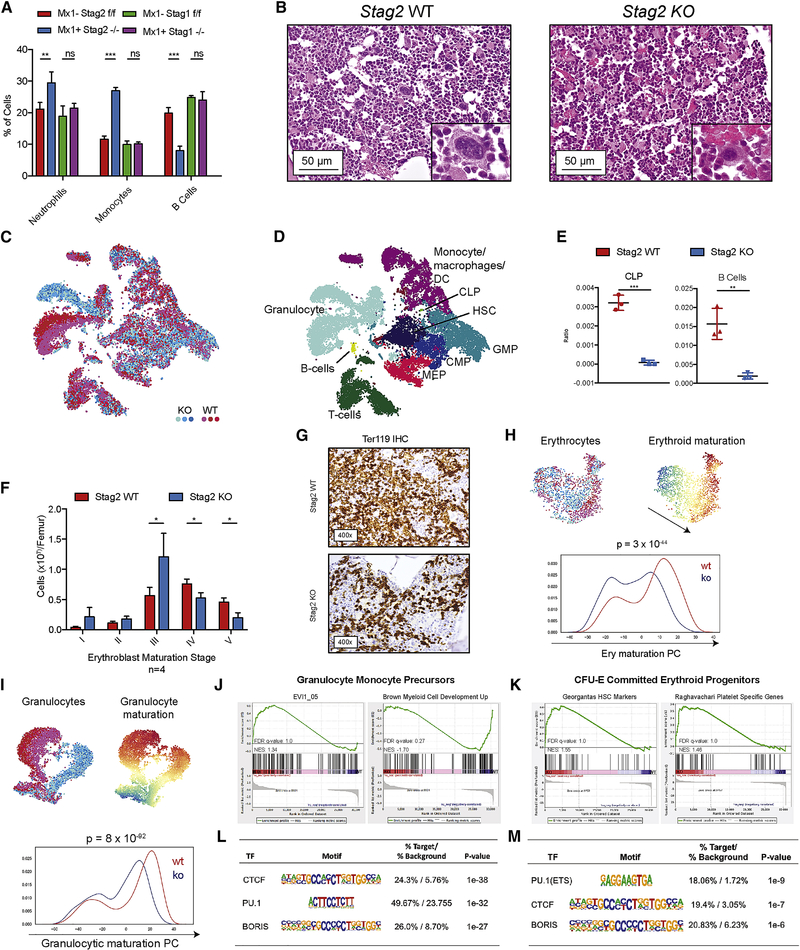
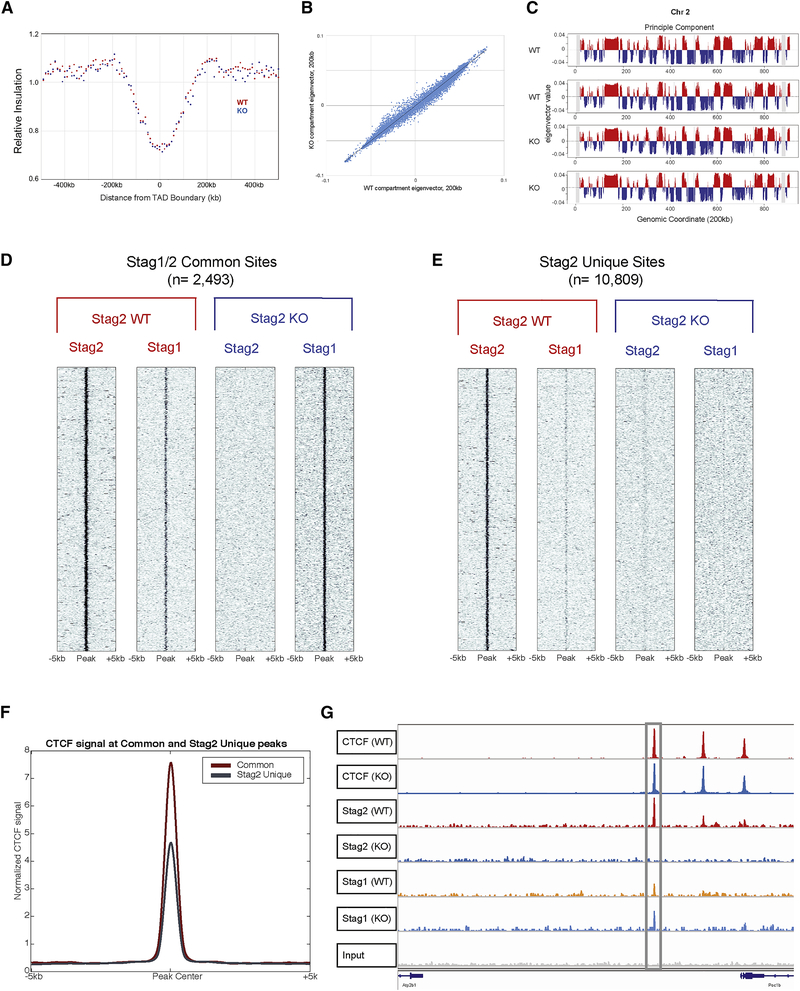
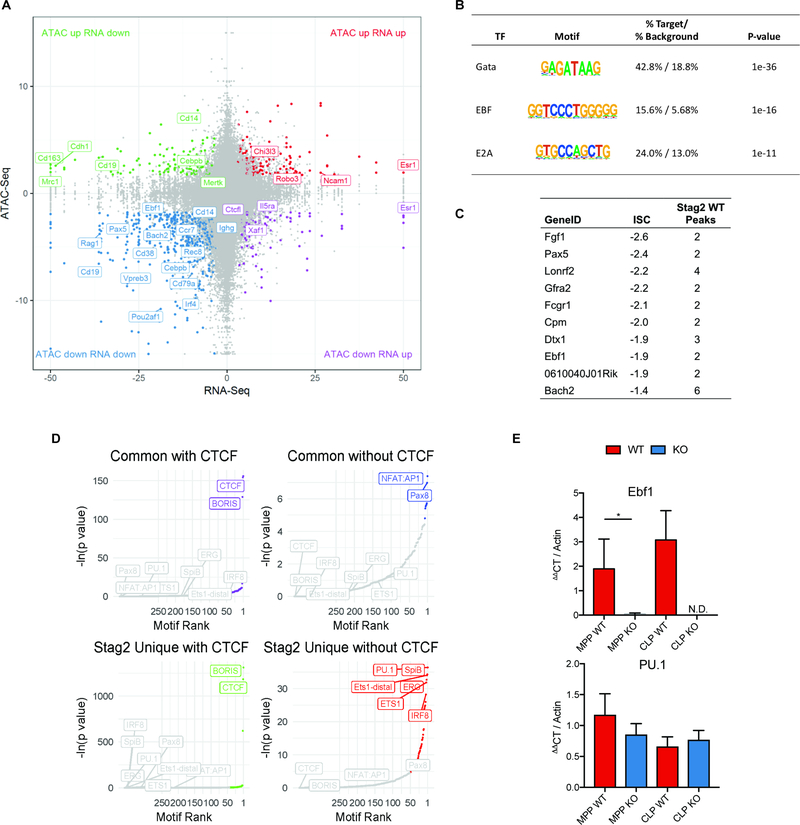
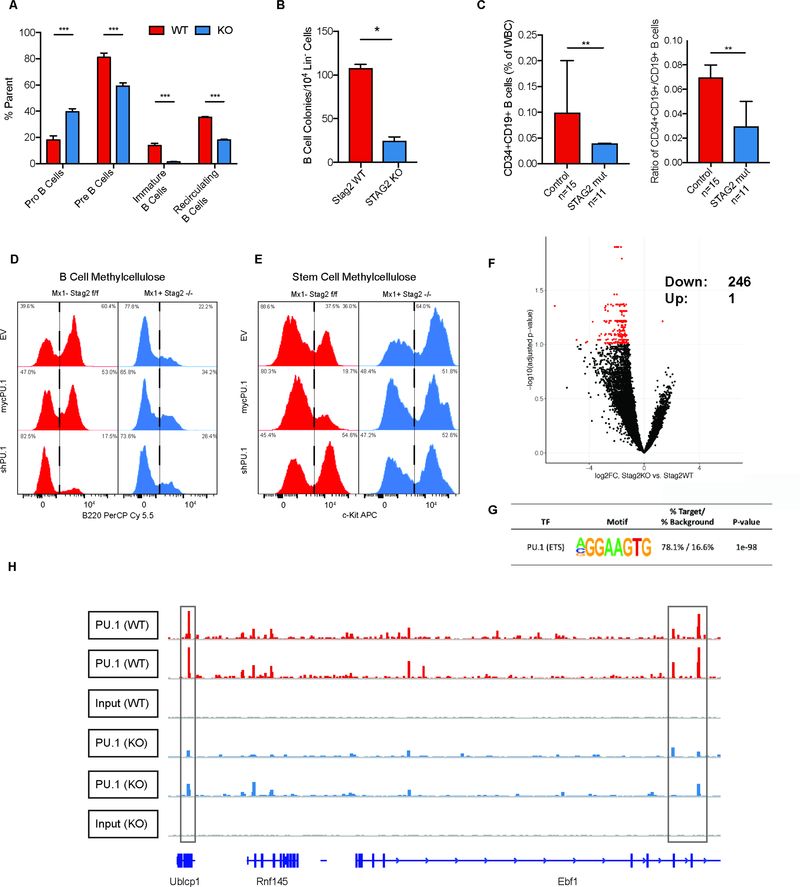
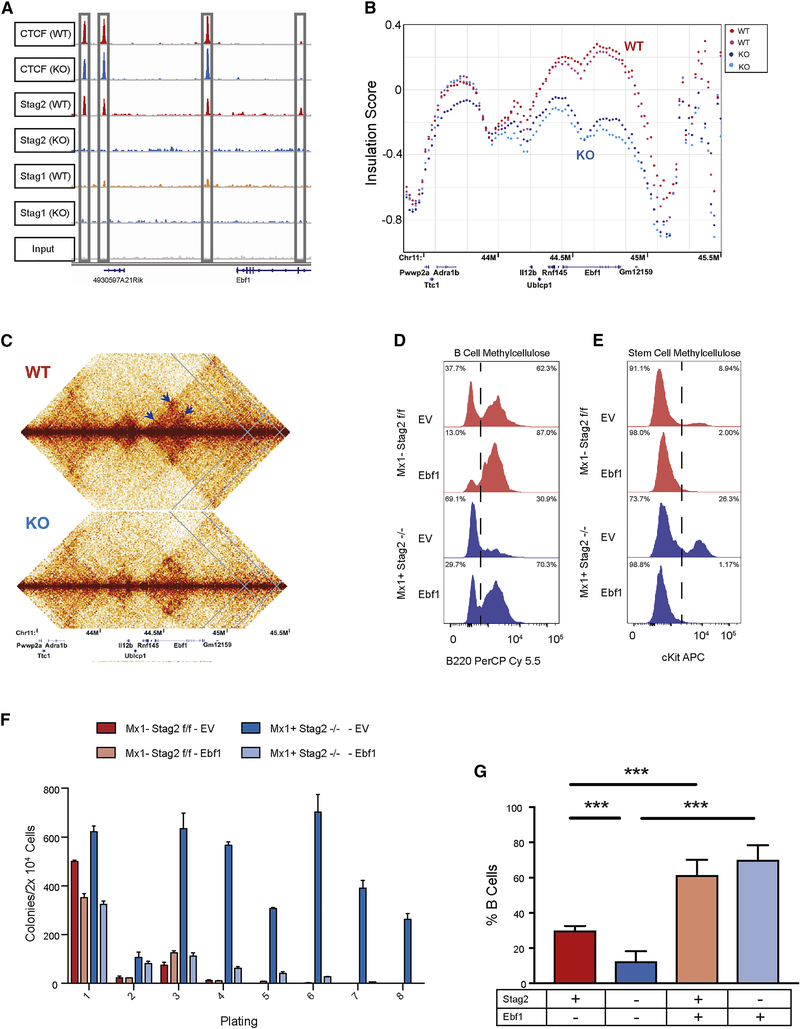
Transcriptional regulators, including the cohesin complex member STAG2, are recurrently mutated in cancer. The role of STAG2 in gene regulation, hematopoiesis, and tumor suppression remains unresolved. We show that Stag2 deletion in hematopoietic stem and progenitor cells (HSPCs) results in altered hematopoietic function, increased self-renewal, and impaired differentiation. Chromatin immunoprecipitation (ChIP) sequencing revealed that, although Stag2 and Stag1 bind a shared set of genomic loci, a component of Stag2 binding sites is unoccupied by Stag1, even in Stag2-deficient HSPCs. Although concurrent loss of Stag2 and Stag1 abrogated hematopoiesis, Stag2 loss alone decreased chromatin accessibility and transcription of lineage-specification genes, including Ebf1 and Pax5, leading to increased self-renewal and reduced HSPC commitment to the B cell lineage. Our data illustrate a role for Stag2 in transformation and transcriptional dysregulation distinct from its shared role with Stag1 in chromosomal segregation.

Keywords: Cohesin; Stag1; Stag2; chromatin; hematopoietic stem cells; mouse models; myelodysplasia; nuclear topology.


Figures

Fig 1.
Fig 1.. Hematopoietic specific loss of Stag2, but not Stag1, results in altered stem cell function.
A) Stag2 KO, but not Stag1 KO mice have increased LSK (LinKit+Sca1+) hematopoietic stem cells (Log2FC=2.2; p<0.01) B) Whole bone marrow plated in cytokine-enriched methylcellulose. Stag2 KO marrow, but not WT and Stag1 KO, has increased self-renewal capacity and can serially replate (>7 platings). Competitive bone marrow transplantation of C) Stag2 WT (Red)/KO (Blue) or D) Stag1 WT (Green)/KO (Purple) bone marrow mixed 1:1 with Cd45.1 normal marrow. Stag2 KO shows increased chimerism in stem and progenitor populations in the bone marrow at 16 weeks. E) Kaplan-Meier curve shows Stag2−/y/Stag1−/− is lethal with a median survival of 0.7 weeks (p=0.01). Stag2−/y/Stag1−/+ has a lethal phenotype with a median survival of 27.7 weeks (p=0.05). F) Hematoxylin and eosin (H&E) staining of Stag2/Stag1 KO bone marrow reveals marked aplasia. G) Left: t-SNE projection of library-size normalized and log transformed data for inferred HSC subset (2025 cells). Each dot represents a single cell colored by genetic condition (Stag2 KO (shades of blue), Stag2 WT (shades of red). Middle: t-SNE projection colored by the second and third principal components most correlated with lymphoid priming and cell cycle, respectively. Right: Distribution of cells along lymphoid and cell cycle components; p-values for Mann-Whitney U test are shown.
Fig 2.
Fig 2.. Stag2 alters transcriptional lineage commitment in stem and progenitor cells.
A) Peripheral blood with increase in Neutrophils (Gr1+Mac1hi), Monocytes (Gr1+Mac1lo), and decrease in B cells (B220+) in Stag2 KO mice. No statistical differences were observed in Stag1 KO mice. B) Hematoxylin and eosin (H&E) staining of sternal bone marrow (400x) from Stag2 KO mice. Increased immature myeloid cells, nuclear-to-cytoplasmic dyssynchrony in erythropoiesis, and small, hypolobated megakaryocytes (Inset image, 1000x). C) Single cell RNA sequencing of Stag2 WT (n=3; shades of red) and Stag2 KO (n=3; shades of blue) Lin HSPC. (C) t-SNE projection of library-size normalized and log transformed data for complete collection (24,153 cells). Each dot represents a single cell colored by genetic condition. D) t-SNE map colored by inferred cell type, as detailed in Figure S4. E) Frequency of CLPs (left) and B-cells (right) in Stag2 WT (red) and KO (blue) samples; asterisks indicate statistical significance (student’s t test, **p<0.01, ***p<0.001) F) Flow cytometry of erythroblast stage in Stag2 WT and KO bone marrow reveals increased erythroblast stage III (p<0.05), reduction of mature erythroblast stage IV (p<0.02) and stage V (p<0.01). G) Immunohistochemical analysis of Stag2 WT and KO bone marrow reveals a marked reduction in Ter-119 expression in Stag2 KO. H) Top left: t-SNE projection of library-size normalized and log transformed data for inferred MEP subset (1787 cells). Each dot represents a single cell colored by genetic condition (Stag2 KO: shades of blue, Stag2 WT: shades of red). Top right: t-SNE projection colored by the second principal component most correlated with erythroid maturation. Bottom: Distribution of cells along erythroid maturation component. I) Top left: t-SNE projection of library-size normalized and log transformed data for inferred granulocytic subset (6316 cells). Each dot represents a single cell colored by genetic condition (Stag2 KO: blue, Stag2 WT: red). Top right: t-SNE projection colored by the first principal component most correlated with granulocyte maturation. Bottom: Distribution of cells along granulocyte maturation component. J) Gene-set enrichment analysis of GMP RNAseq shows increased expression of genes in the Evi1 gene set and decreased expression of myeloid development genes. K) CFU-E RNAseq shows enrichment for the Georgantas HSC markers gene set and retention of platelet specific genes. Integration of differentially expressed genes in L) GMP and M) CFU-E populations with ATAC-sequencing commonly have genes with CTCF/CTCFL (BORIS) motif signatures and PU.1 (ETS) motif signatures with decreased expression and decreased accessibility in both populations.
Fig 3.
Fig 3.. Stag2 and Stag1 possess shared and independent chromatin binding.
A) Insulation pileup plot from each dot shows the median of the interactions for each 200kb bins located 500kb upstream or downstream of a TAD border, normalized by the median interactions for WT and KO, respectively. B) Hi-C insulation scores were normalized by the median interactions for WT and KO, respectively. The diagonal bins were excluded for calculating the median. C) A/B compartments of chr2 for each biological replicate. The A compartments, positive PC1 signals, are highlighted in red, while the B compartments, negative PC1 signals, are highlighted in blue. D) Chromatin immunoprecipitation and sequencing for Stag1 and Stag2 in Stag2 WT and KO HSPC show a discrete subset of the genome where Stag1 is able to bind Stag2 loci in its absence (common sites) and E) discrete loci where Stag1 is unable to bind in the absence of Stag2 (Stag2 unique sites). F) Enrichment of Stag1/2-common sites and Stag2-unique sites for CTCF shows strong enrichment in both sets. G) IGV track at TAD boundary as measured by Hi-C insulation on chromosome 10 showing CTCF occupancy as well as Stag2 in WT with Stag1 occupancy increased in Stag2 KO HSPC.
Fig 4.
Fig 4.. Stag2 loss decreases chromatin insulation and results in impaired transcriptional output.
A) Intersection of RNAseq and ATACseq in Lin bone marrow plotted as −log10(pvalue) *sign of the Log2 fold change of Stag2 KO compared to WT and each point representing a one ATAC peak. The majority of differentially expressed genes lose accessibility, including distinct B-cell regulators (e.g. Ebf1, Pax5, Cd19). B) HOMER motif analysis of genes in lower left quadrant of Figure 4A from intersection of RNAseq and ATACseq in Lin bone marrow. Genes that are downregulated and lose accessibility are targets of Gata (p=10−36), EBF (p=10−16), and E2A (p=10−11). C) Top 10 genes with greatest magnitude of ISC and number of WT Stag2 peaks in the gene. D) Motif analyses of common and Stag2-specific sites with and without CTCF show common enrichment for CTCF and CTCFL (BORIS). Stag2-unique sites bind targets of key lineage priming factors PU.1, SpiB, ERG, ETS1, and IRF8, which Stag1 is unable to bind. E) Putative expressers of PU.1 and Ebf1 from Stag2 WT and KO bone marrow were sorted and Ebf1 and PU.1 expression was measured by RT-PCR in multipotent progenitors (MPP) and common lymphoid progenitors (CLP). Ebf1 expression was decreased in both populations (MPP p=0.04; CLP not detectable). PU.1 expression was not statistically different in either population (MPP p=0.13; CLP p=0.32).
Fig 5.
Fig 5.. Altered Ebf1 chromatin structure results in a blockade of B cell development.
A) Enumeration of B lymphocyte maturation in Stag2 WT and KO mice. Bone marrow was analyzed using flow cytometry for pro- (Cd43+) and pre- (Cd43) B-cells in parent gate B220loIgM showing B-cell development block in the pro-B to pre-B transition (p<0.003). Immature (B220loIgM+) and recirculating B cells (B220hiIgM+) were analyzed as a percentage of live singlets, which were both markedly reduced in Stag2 KO mice (asterisks indicate statistical significance (student’s t test, **p<0.01, ***p<0.001). B) Methylcellulose colony enriched with IL-7, SCF, and FLT3-L shows reduction in the number of B cell colonies in Stag2 KO bone marrow compared to WT (p<0.003). C) Enumeration of immature B cells (CD34+CD19+) and ratio compared to mature B cells (CD34-CD19+) show reduced immature B cells (p<0.010) and immature:mature ratio in STAG2 mutant MDS patients (p<0.008; n=11) compared to controls (n=15). D-E) Stag2 WT and KO HSPC were infected with lentivirus containing GFP-tagged empty vector, GFP-mycPU.1, or GFP-shPU.1; GFP+ cells were plated in either B cell colony methylcellulose or stem cell methylcellulose. Cells were harvested after 7 days and analyzed by flow cytometry for (D) the B marker B220 or (E) stem cell marker cKit. F) Volcano plot for differentially PU.1-occupied loci by chromatin immunoprecipitation sequencing in HSPCs of Stag2 WT and Stag2 KO (data points in red indicate adjusted p<0.1). Loci with decreased in PU.1 occupancy in Stag2 KO to the left (n=246) and loci with increased in PU.1 occupancy in Stag2 KO to the right (n=1). G) HOMER analysis of 246 loci with decreased PU.1 binding shows enrichment for PU.1(ETS) motif (p<1098). H) IGV track of the Ebf1 locus for Stag2 WT (n=2) and KO (n=2) shows decreased PU.1 binding at 3 loci (gray boxes).
Fig 6.
Fig 6.. Induced Ebf1 expression rescues B cell development.
A) IGV track of the Ebf1 locus with Stag2 and Ctcf binding at 4 distinct sites lost in Stag2 KO and not bound by Stag1 either in WT or KO. B) ISC plotted across Ebf1 for Stag2 WT (n=2; shades of red) and KO (n=2; shades of blue) shows marked loss of insulation. C) Contact map of Ebf1 shows loss of cis-interaction at three loci (arrows). D-E) Lin Stag2 WT and KO marrow were infected with retrovirus containing GFP-tagged empty vector or GFP-pCMV-Ebf1. GFP+ cells were plated in either B-cell colony methylcellulose or stem cell methylcellulose. Cells were harvested after 7 days and analyzed by flow cytometry for mature cell markers including (D) the B marker B220 or (E) stem cell markers including cKit. F) Cells plated in stem cell 10 methylcellulose were serially replated with exhaustion of Stag2 KO cell overexpressing Ebf1. G) GFP-tagged empty vector or GFP-pCMV-Ebf1 transduced Lin cells were injected into lethally irradiated CD45.1 recipient mice. Leukocyte populations from the parent gate (GFP+, Cd45.2+, Cd45.1) were analyzed by flow cytometry for percentage of mature B cells. Induced Ebf1 expression restored B cell population frequency from the Stag2 KO HSPC (p<0.001). Asterisks 15 indicate statistical significance (student’s t test, **p<0.01, ***p<0.001)

References

    1. Abdel-Wahab O, Gao J, Adli M, Dey A, Trimarchi T, Chung YR, Kuscu C, Hricik T, Ndiaye-Lobry D, Lafave LM, et al. (2013). Deletion of Asxl1 results in myelodysplasia and severe developmental defects in vivo. The Journal of experimental medicine 210, 2641–2659. - PMC - PubMed
    1. Adolfsson J, Borge OJ, Bryder D, Theilgaard-Monch K, Astrand-Grundstrom I, Sitnicka E, Sasaki Y, and Jacobsen SE (2001). Upregulation of Flt3 expression within the bone marrow Lin(−)Sca1(+)c-kit(+) stem cell compartment is accompanied by loss of self-renewal capacity. Immunity 15, 659–669. - PubMed
    1. Antony-Debre I, Paul A, Leite J, Mitchell K, Kim HM, Carvajal LA, Todorova TI, Huang K, Kumar A, Farahat AA, et al. (2017). Pharmacological inhibition of the transcription factor PU.1 in leukemia. J Clin Invest 127, 4297–4313. - PMC - PubMed
    1. Azizi E, Carr AJ, Plitas G, Cornish AE, Konopacki C, Prabhakaran S, Nainys J, Wu K, Kiseliovas V, Setty M, et al. (2018). Single-Cell Map of Diverse Immune Phenotypes in the Breast Tumor Microenvironment. Cell 174, 1293–1308 e1236. - PMC - PubMed
    1. Bailey ML, O’Neil NJ, van Pel DM, Solomon DA, Waldman T, and Hieter P (2014). Glioblastoma cells containing mutations in the cohesin component STAG2 are sensitive to PARP inhibition. Mol Cancer Ther 13, 724–732. - PMC - PubMed

Publication types

MeSH terms