. 2019 Dec;18(6):e13028.
doi: 10.1111/acel.13028. Epub 2019 Sep 8.

Reversal of epigenetic aging and immunosenescent trends in humans

Affiliations

Reversal of epigenetic aging and immunosenescent trends in humans

Gregory M Fahy et al. Aging Cell. 2019 Dec.

Abstract

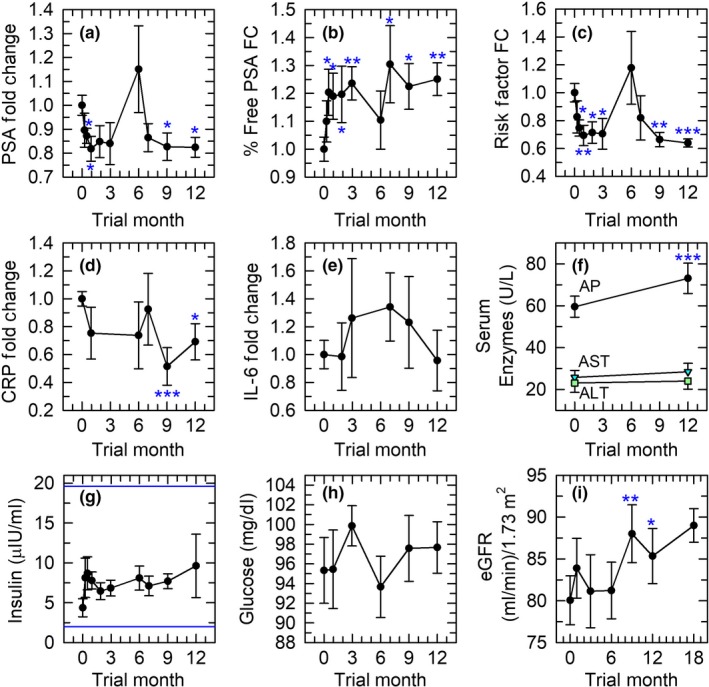
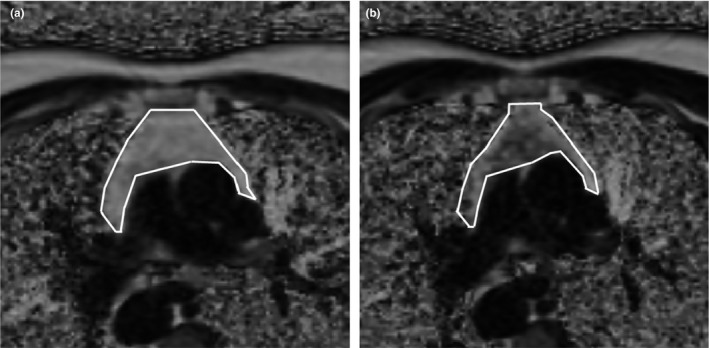
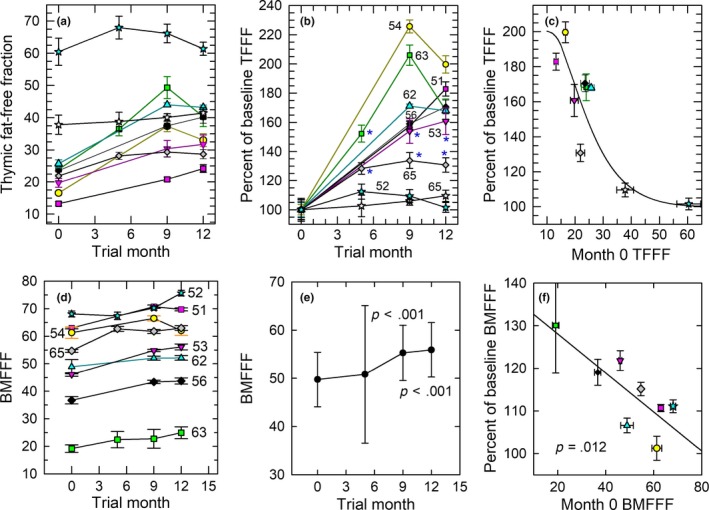
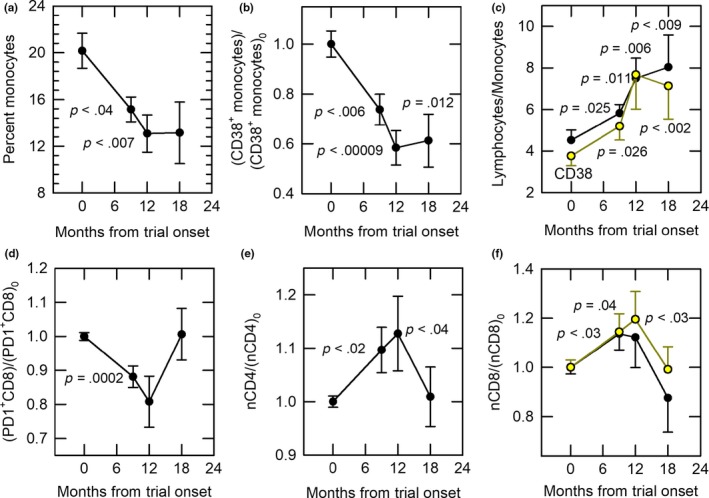
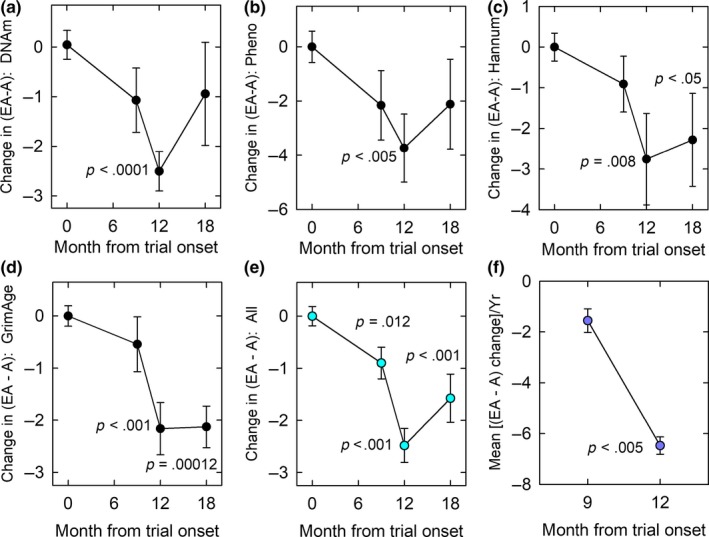
Epigenetic "clocks" can now surpass chronological age in accuracy for estimating biological age. Here, we use four such age estimators to show that epigenetic aging can be reversed in humans. Using a protocol intended to regenerate the thymus, we observed protective immunological changes, improved risk indices for many age-related diseases, and a mean epigenetic age approximately 1.5 years less than baseline after 1 year of treatment (-2.5-year change compared to no treatment at the end of the study). The rate of epigenetic aging reversal relative to chronological age accelerated from -1.6 year/year from 0-9 month to -6.5 year/year from 9-12 month. The GrimAge predictor of human morbidity and mortality showed a 2-year decrease in epigenetic vs. chronological age that persisted six months after discontinuing treatment. This is to our knowledge the first report of an increase, based on an epigenetic age estimator, in predicted human lifespan by means of a currently accessible aging intervention.

Keywords: PD-1; PSA; c-reactive protein; lymphocyte-to-monocyte ratio; naive T cells; thymic regeneration.


Conflict of interest statement

GMF, RTB, JPW, and SH are shareholders in or have options to purchase shares in Intervene Immune, Inc., GMF and RTB are officers of Intervene Immune and are named in a related Intervene Immune patent application. All other authors declare no competing interests.

Figures

Figure 1
Figure 1
Treatment safety indices. In this and other figures, error bars depict SEMs; baseline SEMs for normalized data were obtained as described in Experimental Procedures. Asterisks denote p < .05 (*), p < .01 (**), and p ≤ .001 (***). (a) Prostate‐specific antigen (PSA). (b) Fold change (FC) in percent free PSA. (c) Fold change in the ratio of PSA to percent free PSA (“risk factor”), which rises as prostate cancer risk rises. (d, e) Pro‐inflammatory indices (c‐reactive protein (CRP)) and IL‐6). (f) Serum alkaline phosphatase (AP), aspartate aminotransferase (AST), and alanine aminotransferase (ALT). The increase in AP, while statistically significant, was quantitatively negligible and remained well within the normal range. (g) Maintenance of insulin levels within the upper and lower limits of the normal range (indicated by the horizontal lines). (h) Lack of change in serum glucose, which remained within the normal range. (i) Improvement in estimated GFR at 9 and 12 months of treatment, with a trend toward continued improvement 6 months after discontinuation of treatment
Figure 2
Figure 2
Example of treatment‐induced change in thymic MRI appearance. Darkening corresponds to replacement of fat with nonadipose tissue. White lines denote the thymic boundary. Volunteer 2 at 0 (a) and 9 (b) months
Figure 3
Figure 3
Quantitative MRI‐based regeneration outcomes. Like symbols denote the same individuals in each panel. (a) Individual absolute changes in TFFF. Statistically significant improvements are evident for each individual with the exception of two volunteers who showed high TFFF at baseline (stars); overall significance by linear mixed‐model analysis: p < 9 × 10–17 (see text). (b) Relative changes in TFFF for each individual. The age of each individual at trial entry (noted adjacent to each line) does not correlate with the magnitude of the depicted changes. The highest p values (p > .01) for significant individual responses are denoted with asterisks; for clarity, higher significance levels are not designated. (c) Sigmoidal dependence of TFFF change at 12 months on baseline TFFF, showing greater improvements for thymi with lower basal TFFFs (p < .007). (d) Individual changes in sternal bone marrow fat‐free fraction (BMFFF) (volunteer age noted adjacent to each line). (e) Mean overall changes in BMFFF. (f) Linear dependence of 12‐month BMFFF on basal BMFFF (p = .012), showing the largest relative changes in individuals with the lowest baseline BMFFFs. BMFFF data for one volunteer could not be evaluated
Figure 4
Figure 4
Immunological responses to treatment. (a) Decline (~35%) in monocyte (CD33+ cell) percentages with treatment. When normalized to baseline, the decline in monocytes remained significant even at 18 months (p = .022; Table S1). (b) Persistent decline (~40%) from baseline [(CD38+ monocytes)0] in CD38+ monocytes with treatment. (c) Persistent increase in the lymphocyte‐to‐monocyte cell ratio. Black points: lymphocyte‐to‐monocyte ratio; yellow points: lymphocyte‐to‐CD38+ monocyte ratio. (d) Decrease in normalized PD‐1‐positive CD8 cell percentage with treatment. (e) Increase in normalized naïve CD4 cells (nCD4) vs. baseline [(nCD4)0] with treatment. (f) Increase in normalized naïve CD8 cells with treatment. Black points: all volunteers (p = .03 at 9 months). Yellow points: all volunteers minus the most extreme outlier of Figure 3a–c (represented by blue stars in those figures): p = .04 at 9 months and p < .03 at 12 months
Figure 5
Figure 5
Treatment‐induced changes in epigenetic age. EA, epigenetic age; A, chronological age; changes depicted relative to EA‐A before treatment [(EA‐A)0]. (a) Decline in Horvath epigenetic age by 12 months of treatment. Overall, linear mixed‐model analyses (LMMAs) indicated a P value of .0009 over months 0–12 and .018 over months 0–18. (b) Decline in PhenoAge by 12 months of treatment. LMMA overall P values are .0064 for months 0–12 and .028 for months 0–18. (c) Decline in Hannum epigenetic age by 12 months, and continuing epigenetic age regression to 18 months. LMMA p = .012 for months 0–12 and p = .0092 for months 0–18. (d) Persistent decline in GrimAge age at 12–18 months. LMMA showed p = .0049 for months 0–12 and p = .0016 for months 0–18. (e) Mean of all four epigenetic aging clock results, indicating significant overall epigenetic aging regression at trial months 9–18. By LMMA, p = .0003 for 0–12 mo and .0016 for 0–18 mo. (f) Significant (p < .005) change in the rate of change of [(EA‐A)–(EA‐A)0] between 0–9 months of treatment (plotted at 9 months) and 9–12 months of treatment (plotted at 12 months)

Comment in

References

    1. Akunuru, S. , & Geiger, H. (2016). Aging, clonality and rejuvenation of hematopoietic stem cells. Trends in Molecular Medicine, 22, 701–712. 10.1016/j.molmed.2016.06.003 - DOI - PMC - PubMed
    1. Arnold, C. , Wolf, J. , Brunner, S. , Herndler‐Brandstetter, D. , & Grubeck‐Loebenstein, B. (2011). Gain and loss of T cell subsets in old age – age‐associated reshaping of the T cell repertoire. Journal of Clinical Immunology, 31, 137–146. - PubMed
    1. Barzilai, N. , Crandall, J. P. , Kritchevsky, S. B. , & Espeland, M. A. (2016). Metformin as a tool to study aging. Cell Metabolism, 23, 1060–1065. - PMC - PubMed
    1. Bodey, B. , Bodey, B. J. , Siegel, S. E. , & Kaiser, H. E. (1997). Involution of the mammalian thymus, one of the leading regulators of aging. In Vivo, 11, 421–440. - PubMed
    1. Caglayan, V. , Onen, E. , Avci, S. , Sambel, M. , Kilic, M. , … Yidiz, H. E. (2019). Lymphocyte‐to‐monocyte ratio is a valuable marker to predict cancer in patients with prostate specific antigen between 4 and 10 ng/dl. Archivio Italiano Di Urologia, Andrologia, 90, 270–275. - PubMed

Publication types