. 2019 Aug 6:14:1769-1778.
doi: 10.2147/COPD.S207023. eCollection 2019.

Eicosanoids metabolized through LOX distinguish asthma-COPD overlap from COPD by metabolomics study

Affiliations

Eicosanoids metabolized through LOX distinguish asthma-COPD overlap from COPD by metabolomics study

Chuanxu Cai et al. Int J Chron Obstruct Pulmon Dis. .

Abstract

Background and objective: The prevalence of asthma is greater than 20% in patients previously diagnosed with COPD. Patients with asthma-COPD overlap (ACO) are at risk of rapid progression of disease and severe exacerbations. However, in some patients with ACO, a clear distinction from COPD is very difficult by using physiological testing techniques. This study aimed to apply a novel metabolomic approach to identify the metabolites in sera in order to distinguish ACO from COPD.

Methods: In the study, blood samples were collected from patients with COPD, ACO, and healthy controls. Cholamine derivatization-ultrahigh performance liquid chromatography-quadrupole time-of-flight mass spectrometry (UHPLC-Q-TOF/MS) was used to investigate serum metabolites of eicosanoids.

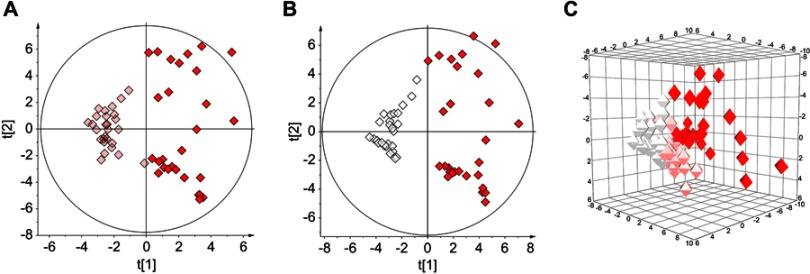
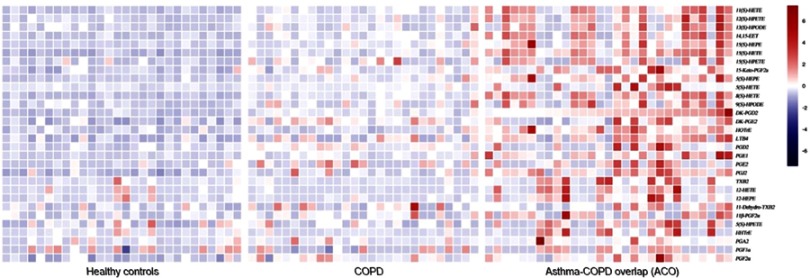
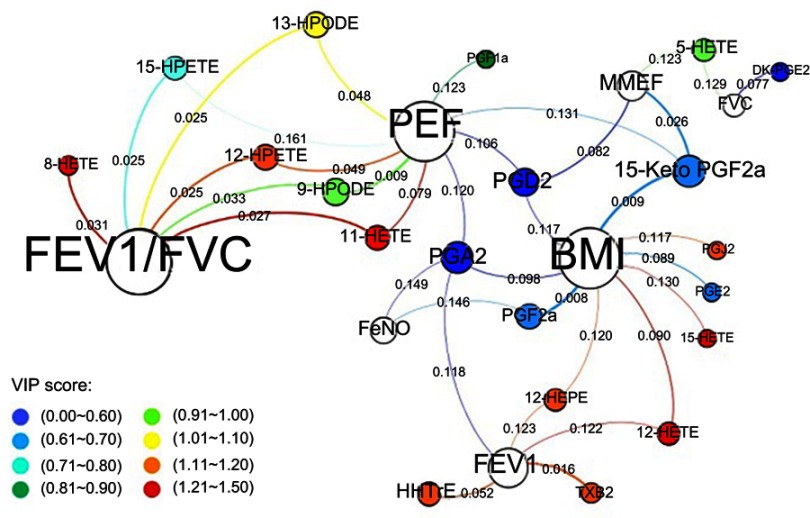
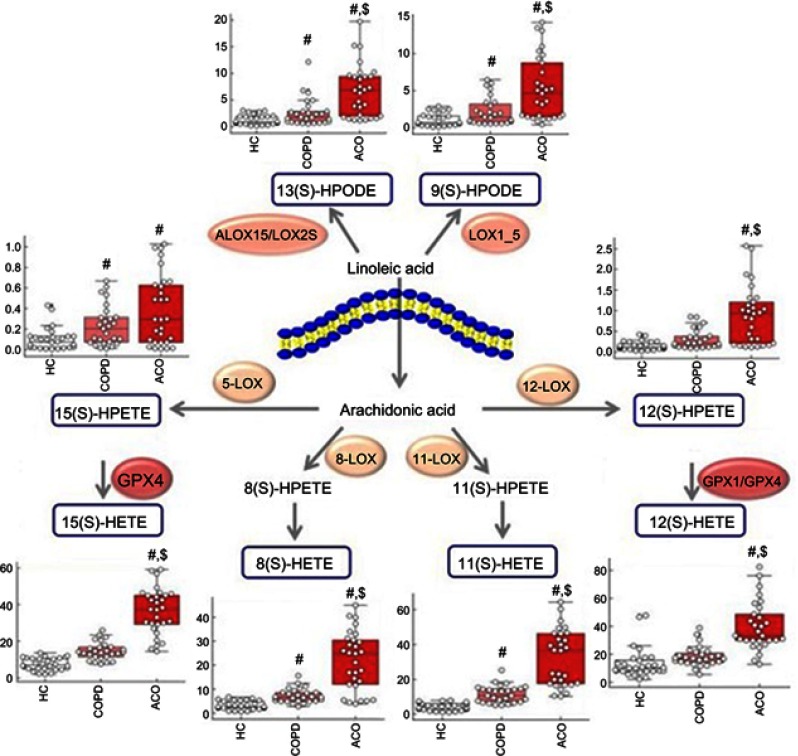
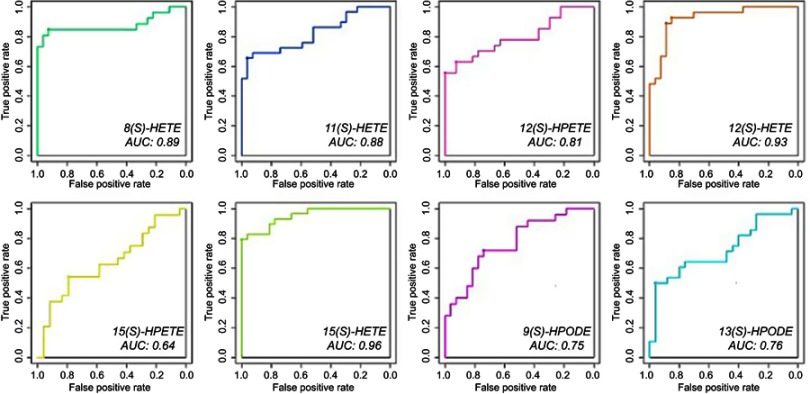
Results: A clear intergroup separation existed between the patients with ACO and those with COPD, while ACO tends to have higher serum metabolic levels of eicosanoids. A robust Orthogonal Projections to Latent Structures-Discriminant Analysis (OPLS-DA) model was found for discriminating between ACO and COPD (R2Y =0.81, Q2=0.79). In addition, there is a significant correlation between some metabolites and clinical indicators, such as hydroxyeicosatetraenoic acids (HETEs), hydroperoxyeicosatetraenoic acids (HPETEs) and FEV1/FVC. The higher values of area under the receiver operating characteristic curves (ROC) of HETEs, which were metabolized from HPETEs through lipoxygenase (LOX), indicated that they should be the potential biomarkers to distinguish ACO from COPD.

Conclusion: Eicosanoids can clearly discriminate different biochemical metabolic profiles between ACO and COPD. The results possibly provide a new perspective to identify potential biomarkers of ACO and may be helpful for personalized treatment.

Keywords: COPD; cholamine derivatization-UHPLC-Q-TOF/MS; metabolomics; asthma–COPD overlap.


Conflict of interest statement

The authors report no conflicts of interest in this work.

Figures

Figure 1
Figure 1
(A) Scores plots of OPLS-DA model separating COPD and asthma–COPD overlap (ACO) (R2Y =0.81, Q2=0.79); (B) Scores plots of OPLS-DA model separating healthy control and ACO (R2Y =0.84, Q2=0.81); (C) 3D-Plot of OPLS-DA model separating healthy control, COPD and ACO. Note: White, healthy control group; pink, COPD group; red, ACO group.
Figure 2
Figure 2
Heatmap analysis of eicosanoids levels in serum of healthy control, COPD, and asthma–COPD overlap (ACO).
Figure 3
Figure 3
Spring-embedded correlation plot illustrating the relationship between eicosanoids and clinical parameters. Notes: The size of the node is proportional to the weight of the relationship with metabolite (the larger the circle, the more correlation the metabolite). Node color directly maps onto the VIP score of metabolites between COPD and asthma–COPD overlap (ACO) (see bottom left of the figure). The length of the line between the nodes (spring length) is proportional to the correlation strength (the shorter the length, the stronger the correlation with neighboring metabolites). The thickness of the line is proportional to the significance of correlation (more thicker the line, the more significant the metabolites).
Figure 4
Figure 4
Proposed metabolic pathway of the relevant eicosanoids. White column: healthy control (HC) group; pink column: COPD group; red column:  asthma–COPD overlap (ACO) group. #, significantly compared with healthy control; $, significantly compared with COPD.
Figure 5
Figure 5
Receiver operating characteristic (ROC) curves of relevant eicosanoids.

Similar articles

Cited by

References

    1. Gelb AF, Christenson SA, Nadel JA. Understanding the pathophysiology of the asthma-chronic obstructive pulmonary disease overlap syndrome. Curr Opin Pulm Med. 2016;22(2):100–105. doi:10.1097/MCP.0000000000000236 - DOI - PubMed
    1. Yanagisawa S, Ichinose M. Definition and diagnosis of asthma-COPD overlap (ACO). Allergol Int. 2018;67(2):172–178. doi:10.1016/j.alit.2018.01.002 - DOI - PubMed
    1. Wang J, Lv H, Luo Z, et al. Plasma YKL-40 and NGAL are useful in distinguishing ACO from asthma and COPD. Respir Res. 2018;19(1):47. doi:10.1186/s12931-018-0755-6 - DOI - PMC - PubMed
    1. Mindus S, Malinovschi A, Ekerljung L, et al. Asthma and COPD overlap (ACO) is related to a high burden of sleep disturbance and respiratory symptoms: results from the RHINE and Swedish GA2LEN surveys. PLoS One. 2018;13(4):e195055. doi:10.1371/journal.pone.0195055 - DOI - PMC - PubMed
    1. Sorino C, Scichilone N, D’Amato M, Patella V, DI Marco F. Asthma-COPD overlap syndrome: recent advances in diagnostic criteria and prognostic significance. Minerva Med. 2017;108(3 Suppl 1):1–5. doi:10.23736/S0026-4806.17.05321-6 - DOI - PubMed

MeSH terms