. 2019 Aug 6:14:6197-6215.
doi: 10.2147/IJN.S206934. eCollection 2019.

Mechano-signalling, induced by fullerene C60 nanofilms, arrests the cell cycle in the G2/M phase and decreases proliferation of liver cancer cells

Affiliations

Mechano-signalling, induced by fullerene C60 nanofilms, arrests the cell cycle in the G2/M phase and decreases proliferation of liver cancer cells

Malwina Sosnowska et al. Int J Nanomedicine. .

Abstract

Introduction and objective: Degradation of the extracellular matrix (ECM) changes the physicochemical properties and dysregulates ECM-cell interactions, leading to several pathological conditions, such as invasive cancer. Carbon nanofilm, as a biocompatible and easy to functionalize material, could be used to mimic ECM structures, changing cancer cell behavior to perform like normal cells.

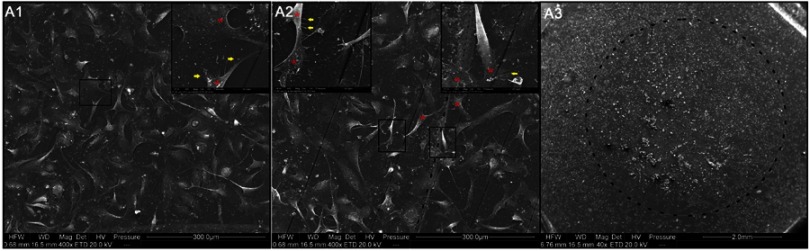
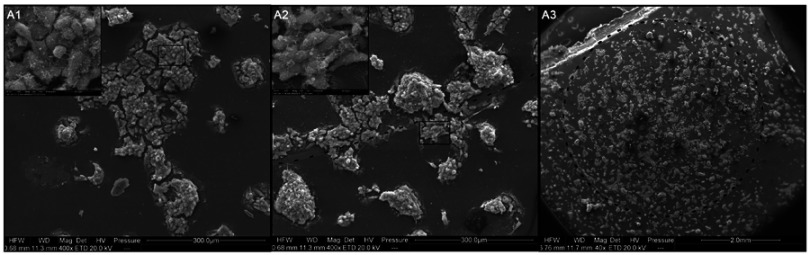
Methods: Experiments were performed in vitro with HS-5 cells (as a control) and HepG2 and C3A cancer cells. An aqueous solution of fullerene C60 was used to form a nanofilm. The morphological properties of cells cultivated on C60 nanofilms were evaluated with light, confocal, electron and atomic force microscopy. The cell viability and proliferation were measured by XTT and BrdU assays. Immunoblotting and flow cytometry were used to evaluate the expression level of proliferating cell nuclear antigen and determine the number of cells in the G2/M phase.

Results: All cell lines were spread on C60 nanofilms, showing a high affinity to the nanofilm surface. We found that C60 nanofilm mimicked the niche/ECM of cells, was biocompatible and non-toxic, but the mechanical signal from C60 nanofilm created an environment that affected the cell cycle and reduced cell proliferation.

Conclusion: The results indicate that C60 nanofilms might be a suitable, substitute component for the niche of cancer cells. The incorporation of fullerene C60 in the ECM/niche may be an alternative treatment for hepatocellular carcinoma.

Keywords: adhesion; cell cycle; extracellular matrix; fullerene; liver cancer cells.


Conflict of interest statement

The authors report no conflicts of interest in this work.

Figures

Figure 1
Figure 1
Preparation and characterization of C60 nanofilms. Notes: (A) Nanofilms pattern of dots: 1=0 dots (control); 2=10 dots, C60-20%; 3=17 dots; 4=28 dots; 5=37 dots; 6= covering the entire surface, C60-100%. (B) Characterization of fullerenes by transmission electron microscopy (TEM) (1, 2) and scanning electron microscopy (SEM) (3, 4). Scale bars: 500 nm (1), 100 nm (2), 10 µm (3) and 5 µm (4). Agglomerates were observed in the colloid of nanoparticles (black arrowheads). (C) Infrared spectrum of C60 registered in the middle region (3500–500 cm−1). Characteristic transmission bands were assigned to the appropriate vibrations of groups and bands present in the studied samples. (D) Comparison between the Petri dish uncoated and coated with C60 made by means of AFM. The side width of the images is 10 μm for the upper row and 2 μm for the lower. The left micrographs are of the uncoated plate and the right micrographs are of the C60 coated plate. Abbreviations: C60, fullerenes; Ra, roughness (nm).
Figure 2
Figure 2
(A) Elasticity modulus (kPa) of HS-5, HepG2 and C3A cells on C60 nanofilms. (B) Viability of HS-5, HepG2 and C3A cells after growth on 20 µg of C60 nanofilms. (C) Proliferation of HS-5, HepG2 and C3A cells on C60 nanofilms. (D) Three-dimensional AFM images of HepG2 (D1, D2) and C3A (D3, D4) cells. Notes: The differences between the cell lines were significant (P≤0.05). Different letters indicate significant differences between the groups (ANOVA, Tukey’s post-test). The differences between the carbon-grown groups (20 µg of C60 nanofilm) and the control group were significant (P≤0.05) (ANOVA, Tukey’s post-test) for HS-5 cells. Different letters indicate significant differences between the groups. Controls are shown in the pictures D1 and D3. The cell nuclei (black arrowheads) were observed using AFM. Abbreviations: ANOVA, analysis of variance; C, control; C60, fullerenes; XTT, 2,3-bis(2-methoxy-4-nitro-5-sulfophenyl)-5-[(phenylamino)carbonyl]-2H-tetrazolium hydroxide; BrdU, 5-bromo-2ʹ-deoxyuridine. AFM, atomic force microscopy.
Figure 3
Figure 3
Propidium iodide (PI) 488 assay analysis. Notes: Effect of C60 on the number (percentage) of (A) HS-5, (B) HepG2 or (C) C3A cells in the cycle phases. (D) Relative HS-5, HepG2 and C3A cell population in G2/M cycle (%). (E) Western blot analysis of β-catenin, N-cadherin, vinculin and PCNA. GAPDH was used as a loading control. Abbreviations: C60, fullerenes; GAPDH, glyceraldehyde 3-phosphate dehydrogenase; PCNA, proliferating cell nuclear antigen.
Figure 4
Figure 4
Morphology changes and affinity of HS-5 cells to the C60 nanofilms. Notes: Hematoxylin-eosin (H+E) staining of HS-5 cells on C60 nanofilms visualized using light optical microscopy. (A1) control group; (A2) C60-20%; and (A3): C60-100%. Black arrows indicate the direction of cell migration. Scale bars: left pictures 100 μm; right pictures 20 μm. Abbreviation: C60, fullerenes.
Figure 5
Figure 5
Morphology changes and affinity of HepG2 cells to the C60 nanofilms. Notes: Hematoxylin-eosin staining of HepG2 cells on C60 nanofilms visualized using light optical microscopy. (A1) Control group; (A2) C60-20%; and (A3) C60-100%. Black arrows indicate the direction of cell migration. Scale bars: left pictures 100 μm, right pictures 20 μm. Abbreviation: C60, fullerenes.
Figure 6
Figure 6
Morphology changes and affinity of C3A cells to the C60 nanofilms. Notes: Hematoxylin-eosin staining of C3A cells on C60 nanofilms visualized using light optical microscopy. (A1) Control group; (A2) C60-20%; and (A3) C60-100%. Black arrows indicate the direction of cell migration. Scale bars: left pictures 100 μm, right pictures 20 μm. Abbreviation: C60, fullerenes.
Figure 7
Figure 7
Visualization of the interaction of HS-5 cells with nanofilms using scanning electron microscopy. Notes: (A1) Control group (A2 and A3) C60-20%. Red stars and yellow arrows indicate lamellipodia and filopodia, respectively. The dotted line indicates edges of the dots. Scale bars: A1 and A2 =300 μm and 20 μm, A3 =2.0 mm. Abbreviation: C60, fullerenes.
Figure 8
Figure 8
Visualization of the interaction of HepG2 cells with nanofilms using scanning electron microscopy. Notes: (A1) Control group; (A2 and A3) C60-20%. The dotted line indicates edges of the dots. Scale bars: A1 and A2 =300 μm and 20 μm, A3 =2.0 mm. Abbreviation: C60, fullerenes.
Figure 9
Figure 9
Visualization of the interaction of C3A cells with nanofilms using scanning electron microscopy. Notes: (A1) Control group; (A2 and A3) C60-20%. Red and blue points indicate lamellipodia and the 3-D ECM structure, respectively. The dotted line indicates edges of the dots. Scale bars: A1 =300 μm and 20 μm, A2 =300 μm, 50 μm and 20 μm, A3 =2.0 mm. Abbreviation: C60, fullerenes.
Figure 10
Figure 10
Expression level of integrin α5β1 and changes in cell morphology on fullerenes nanofilms. Notes: HS-5 cells were stained with DAPI (nuclei, blue), phalloidin-Atto 633 (cytoskeleton, red) and fluorescent secondary antibody 488 FITC (integrin, green) and visualized using confocal microscopy and Nomarski interference contrast. (A1) Control group; (A2) C60-20%; and (A3) C60-100%. Scale bar: 20 μm. Abbreviations: C60, fullerenes; DAPI, 4′,6-diamidino-2-phenylindole; FITC, fluorescein isothiocyanate.
Figure 11
Figure 11
Expression level of integrin α5β1 and changes in cell morphology on fullerenes nanofilms. Notes: HepG2 cells were stained with DAPI (nuclei, blue), phalloidin-Atto 633 (cytoskeleton, red) and fluorescent secondary antibody 488 FITC (integrin, green) and visualized using confocal microscopy and Nomarski interference contrast. (A1) Control group; (A2) C60-20%; and (A3) C60-100%. Scale bar: 20 μm. Abbreviations: C60, fullerenes; DAPI, 4′,6-diamidino-2-phenylindole; FITC, fluorescein isothiocyanate.
Figure 12
Figure 12
Expression level of integrin α5β1 and changes in cell morphology on fullerenes nanofilms. Notes: C3A cells were stained with DAPI (nuclei, blue), phalloidin-Atto 633 (cytoskeleton, red) and fluorescent secondary antibody 488 FITC (integrin, green) and visualized using confocal microscopy and Nomarski interference contrast. (A1) Control group; (A2) C60-20%; and (A3) C60-100%. Scale bar: 20 μm. Abbreviations: C60, fullerenes; DAPI, 4′,6-diamidino-2-phenylindole; FITC, fluorescein isothiocyanate.

Similar articles

Cited by

References

    1. Schrader J, Gordon-Walker TT, Aucott RL, et al. Matrix stiffness modulates proliferation, chemotherapeutic response, and dormancy in hepatocellular carcinoma cells. Hepatology. 2011;53(4):1192–1205. doi:10.1002/hep.24108 - DOI - PMC - PubMed
    1. Mittal S, El-Serag HB. Epidemiology of HCC: consider the population. J Clin Gastroenterol. 2013;47:S2–S6. doi:10.1097/MCG.0b013e3182872f29 - DOI - PMC - PubMed
    1. Yau WL, Lam CSC, Ng L, et al. Over-expression of miR-106b promotes cell migration and metastasis in hepatocellular carcinoma by activating epithelial-mesenchymal transition process. PLoS One. 2013;8(3):e57882. doi:10.1371/journal.pone.0057882 - DOI - PMC - PubMed
    1. Wai CT, Greenson JK, Fontana RJ, et al. A simple non-invasive index can predict both significant fibrosis and cirrhosis in patients with chronic hepatitis C. Hepatology. 2003;38(2):518–526. doi:10.1053/jhep.2003.50346 - DOI - PubMed
    1. Wynn TA, Ramalingam TR. Mechanisms of fibrosis: therapeutic translation for fibrotic disease. Nat Med. 2012;18(7):1028–1040. doi:10.1038/nm.2807 - DOI - PMC - PubMed

MeSH terms