

Serial Metabolic Evaluation of Perihematomal Tissues in the Intracerebral Hemorrhage Pig Model
- PMID: 31496934
- PMCID: PMC6712426
- DOI: 10.3389/fnins.2019.00888
Serial Metabolic Evaluation of Perihematomal Tissues in the Intracerebral Hemorrhage Pig Model
Abstract
Purpose: Perihematomal edema (PHE) occurs in patients with intracerebral hemorrhage (ICH) and is often used as surrogate of secondary brain injury. PHE resolves over time, but little is known about the functional integrity of the tissues that recover from edema. In a pig ICH model, we aimed to assess metabolic integrity of perihematoma tissues by using non-invasive magnetic resonance spectroscopy (MRS).
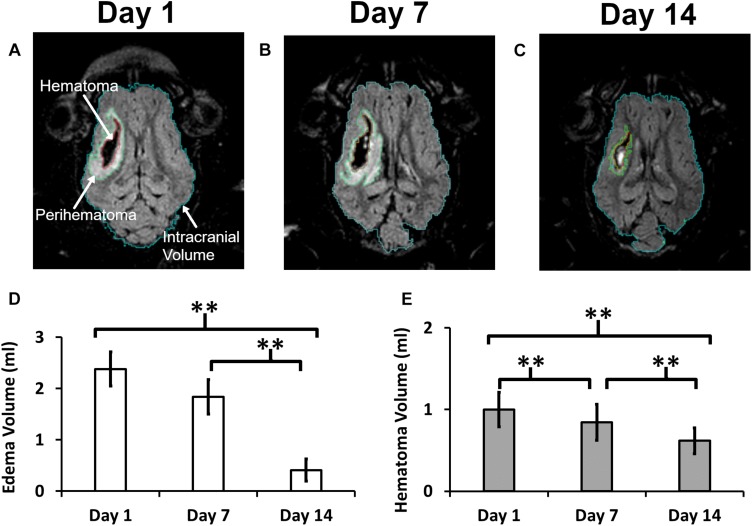
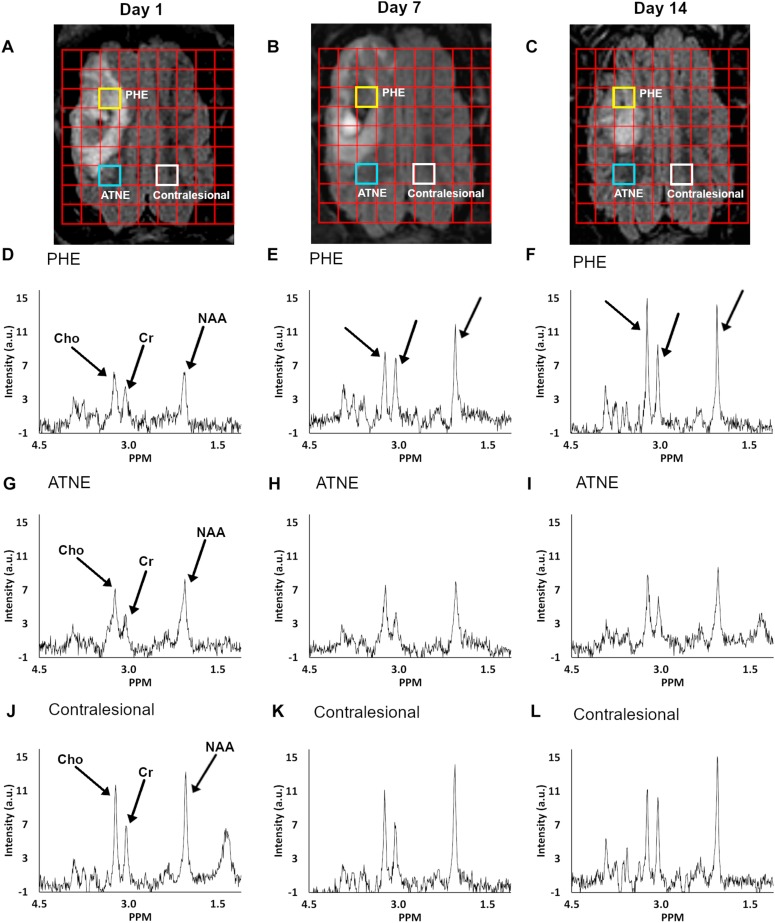
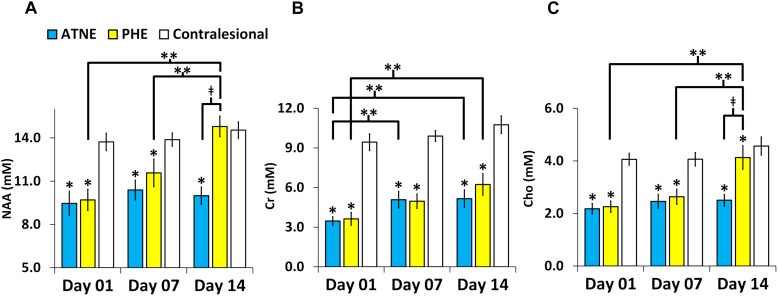
Materials and methods: Fourteen male Yorkshire pigs with an average age of 8 weeks were intracerebrally injected with autologous blood to produce ICH. Proton MRS data were obtained at 1, 7, and 14 days after ICH using a whole-body 3.0T MRI system. Point-resolved spectroscopy (PRESS)-localized 2D chemical shift imaging (CSI) was acquired. The concentration of N-Acetylaspartate (NAA), Choline (Cho), and Creatine (Cr) were measured within the area of PHE, tissues adjacent to the injury with no or negligible edema (ATNE), and contralesional brain tissue. A linear mixed model was used to analyze the evolution of metabolites in perihematomal tissues, with p-value < 0.05 indicating statistical significance.
Results: The perihematoma volume gradually decreased from 2.38 ± 1.23 ml to 0.41 ± 0.780 ml (p < 0.001) over 2 weeks. Significant (p < 0.001) reductions in NAA, Cr, and Cho concentrations were found in the PHE and ATNE regions compared to the contralesional hemisphere at day 1 and 7 after ICH. All three metabolites were significantly (p < 0.001) restored in the PHE tissue on day 14, but remained persistently low in the ATNE area, and unaltered in the contralesional voxel.
Conclusion: This study highlights the potential of MRS to probe salvageable tissues within the perihematoma in the sub-acute phase of ICH. Altered metabolites within the PHE and ATNE regions in addition to edema and hematoma volumes were explored as possible markers for tissue recovery. Perihematomal tissue with PHE demonstrated a more reversible injury compared to the tissue adjacent to the injury without edema, suggesting a potentially beneficial role of edema.
Keywords: intracerebral hemorrhage; magnetic resonance spectroscopy; perihematomal edema; pig ICH model; serial neuroimaging study.
Figures
References
-
- Al-Shahi Salman R., Frantzias J., Lee R. J., Lyden P. D., Battey T. W. K., Ayres A. M., et al. (2018). Absolute risk and predictors of the growth of acute spontaneous intracerebral haemorrhage: a systematic review and meta-analysis of individual patient data. Lancet Neurol. 17 885–894. 10.1016/S1474-4422(18)30253-9 - DOI - PMC - PubMed
Grants and funding
LinkOut - more resources
Full Text Sources