. 2019 Aug 21:13:387.
doi: 10.3389/fncel.2019.00387. eCollection 2019.

Changes in Activity of Spinal Postural Networks at Different Time Points After Spinalization

Affiliations

Changes in Activity of Spinal Postural Networks at Different Time Points After Spinalization

Pavel V Zelenin et al. Front Cell Neurosci. .

Abstract

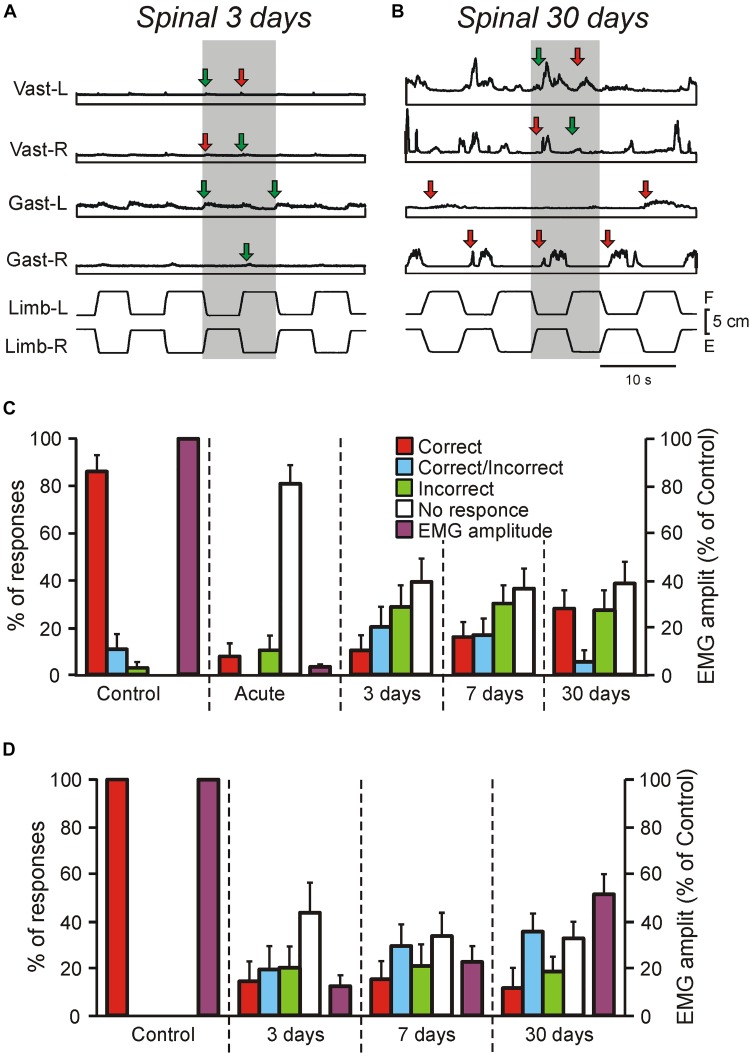
Postural limb reflexes (PLRs) are an essential component of postural corrections. Spinalization leads to disappearance of postural functions (including PLRs). After spinalization, spastic, incorrectly phased motor responses to postural perturbations containing oscillatory EMG bursting gradually develop, suggesting plastic changes in the spinal postural networks. Here, to reveal these plastic changes, rabbits at 3, 7, and 30 days after spinalization at T12 were decerebrated, and responses of spinal interneurons from L5 along with hindlimb muscles EMG responses to postural sensory stimuli, causing PLRs in subjects with intact spinal cord (control), were characterized. Like in control and after acute spinalization, at each of three studied time points after spinalization, neurons responding to postural sensory stimuli were found. Proportion of such neurons during 1st month after spinalization did not reach the control level, and was similar to that observed after acute spinalization. In contrast, their activity (which was significantly decreased after acute spinalization) reached the control value at 3 days after spinalization and remained close to this level during the following month. However, the processing of postural sensory signals, which was severely distorted after acute spinalization, did not recover by 30 days after injury. In addition, we found a significant enhancement of the oscillatory activity in a proportion of the examined neurons, which could contribute to generation of oscillatory EMG bursting. Motor responses to postural stimuli (which were almost absent after acute spinalization) re-appeared at 3 days after spinalization, although they were very weak, irregular, and a half of them was incorrectly phased in relation to postural stimuli. Proportion of correct and incorrect motor responses remained almost the same during the following month, but their amplitude gradually increased. Thus, spinalization triggers two processes of plastic changes in the spinal postural networks: rapid (taking days) restoration of normal activity level in spinal interneurons, and slow (taking months) recovery of motoneuronal excitability. Most likely, recovery of interneuronal activity underlies re-appearance of motor responses to postural stimuli. However, absence of recovery of normal processing of postural sensory signals and enhancement of oscillatory activity of neurons result in abnormal PLRs and loss of postural functions.

Keywords: balance control; postural reflexes; spasticity; spinal cord injury; spinal networks; spinal neurons.


Figures

FIGURE 1
FIGURE 1
Experimental designs. (A–D) A design for acute experiments. The chronic spinalized at T12 level rabbit was decerebrated and fixed in a rigid frame [points of fixation are indicated by black circles in (A)]. The whole platform (C) or its left or right part [Plat L and Plat R in (D)] could be periodically tilted, causing flexion–extension movements [F and E in (E), respectively] of the two limbs (in anti-phase) or one of them, respectively. These movements were monitored by mechanical sensors (Limb-L and Limb-R, respectively). Activity of spinal neurons from L5 was recorded by means of the microelectrode [ME in (A)]. (E) Responses of a neuron from the left side of the spinal cord (Neuron-L) and electromyographic (EMG) responses in the left and right m. gastrocnemius lateralis (Gast-L and Gast-R, respectively) and m. vastus lateralis (Vast-L and Vast-R, respectively) to flexion/extension anti-phase movements of the hindlimbs in the rabbit on day 7 after spinalization. Red and green arrows indicate, respectively, residual correctly and incorrectly phased (in relation to the platform tilts), responses in Vast and Gast muscles. White arrows indicate oscillatory bursts in neuronal response. (F,G) A raster of responses of the neuron shown in (E) in four sequential movement cycles of the ipsilateral limb and a histogram of its spike activity in different phases (1–12) of the cycle of movement (F, flexion; E, extension) of the ipsilateral limb (Limb-ip). The neuron was activated with flexion of the ipsilateral limb (F-neuron). The halves of the cycle with higher (F, bins 1–6) and lower (E, bins 7–12) neuronal activity were designated as “burst” and “interburst” periods, respectively. (H–K) Testing of postural reactions to tilts. The animal was standing on two platforms, one under the forelimbs and one under the hindlimbs. Platform under the hindlimbs could be tilted in the transverse plane (α is the platform tilt angle). The sagittal plane of the animal was aligned with the axis of platform rotation. (J) Normal postural reaction to tilt in intact rabbit. (K) Absence of postural reaction to tilt in spinal rabbit.
FIGURE 2
FIGURE 2
Motor responses of rabbits and decerebrate preparations to tilts in control and at different time points after spinalization. (A–C) EMG responses to the whole platform tilts in the rabbit decerebrated on day 3 after spinalization (A) and in the rabbit decerebrated on day 30 after spinalization. The EMGs of the following muscles are presented: left (L) and right (R) vastus (Vast), and gastrocnemius (Gast). Red and green arrows in (A,B) indicate onsets of correct and incorrect responses, respectively. (C) Proportion of different types of EMG responses to the whole platform tilts in Vast and Gast recorded in decerebrate rabbits with intact spinal cord (Control, N = 5, n = 50), after acute spinalization (Acute, N = 5, n = 50), at 3 days (N = 3, n = 18), 7 days (N = 3, n = 24), and 30 days (N = 6, n = 34) after spinalization, as well as their amplitude in control and after acute spinalization (N = 3, n = 18). Correct, activation with ipsi-limb flexion; Incorrect, activation with contra-limb flexion; Correct/Incorrect, activation with both movements; No response, no EMG response to tilt. (D) Proportion of different types of EMG responses to the whole platform tilts in Vast and Gast recorded in the same rabbits before spinalization, at 3, 7, and 30 days after spinalization, as well as their amplitude (N = 3, n = 37, 39, and 40, respectively). Correct, activation with ipsilateral tilt; Incorrect, activation with contralateral tilt; Correct/Incorrect, activation with both ipsi- and contra-tilts; No response, no EMG response to tilt.
FIGURE 3
FIGURE 3
Neurons recorded at different time points after spinalization. (A,B) Position of all F- and E-neurons (A), as well as all non-modulated neurons (B) on the cross-section of the spinal cord recorded on 3rd, 7th, and 30th day after spinalization. (C) Relative number of F-, E-, and non-modulated neurons in control and at different time points after spinalization. The number of F-, E-, and non-modulated neurons, respectively, was n = 249, 186, and 64 in control, n = 122, 127, and 121 after acute spinalization, n = 91, 76, and 108 on day 3, n = 98, 68, and 69 on day 7, and n = 93, 86, and 86 on day 30 after spinalization. (D) Activity of non-modulated spinal neurons in control and at different time points after spinalization. The mean and SEM. values of the mean frequency of non-modulated neurons recorded in control, after acute spinalization (Acute), as well as at 3, 7, and 30 days after spinalization are shown for sub-populations of non-modulated neurons located in different zones (1–3) of the gray matter. The numbers of non-modulated neurons recorded in zones 1–3 in control and after acute spinalization were n = 14, 27, 23 and n = 18, 44, 59, respectively. The numbers of non-modulated neurons recorded in zones 1–3 in spinal rabbits on 3rd, 7th, and 30th day after spinalization were n = 9, 60, 39, n = 17, 32, 20, and n = 11, 38, 37, respectively. Indication of significance level: p < 0.05.
FIGURE 4
FIGURE 4
The activity of F-neurons and E-neurons during tilts of the whole platform in control and at different time points after spinalization. The mean and SEM. values of different characteristics of the activity [the mean frequency (A,E), the depth of modulation (B,F), the burst frequency (C,G), and the interburst frequency (D,H)] of F-neurons (A–D) and E-neurons (E–H) in control (Control), after acute spinalization (Acute), and on 3rd, 7th, and 30th days after spinalization (3, 7, and 30 days, respectively). These values are shown for sub-populations of F- and E-neurons located in different zones (1–3) of the gray matter (Figures 3A,B). The numbers of F-neurons recorded in zones 1, 2, 3 in control were n = 62, 94, 93, after acute spinalization – n = 30, 49, 43, on 3 day – n = 15, 36, 40, on 7th day – n = 24, 38, 36, on 30th day – n = 21, 39, 33. The numbers of E-neurons recorded in zones 1, 2, 3 in control were n = 49, 63, 74, after acute spinalization – n = 30, 78, 19, on 3 day – n = 12, 37, 27, on 7th day – n = 17, 18, 33, on 30th day – n = 20, 35, 28. Indication of significance level: p < 0.05, ∗∗p < 0.01, and ∗∗∗p < 0.001.
FIGURE 5
FIGURE 5
Changes in the mean frequency and in the depth of modulation of local populations of F- and E-neurons at different time points after spinalization. The difference between the averaged distribution of the mean frequency (A–D,I–L) and of the depth of modulation (E–H,M–P) of F-neurons (A–H) and E-neurons (I–P) on the cross-section of the spinal cord at a particular time point after spinalization and the corresponding distribution in control (subtraction of Control from corresponding spinal). Averaged distributions of the mean frequency and depth of modulation for F- and E-neurons in control, after acute spinalization, as well as on 3rd, 7th, and 30th day after spinalization are presented as heatmaps in Supplementary Figure S1.
FIGURE 6
FIGURE 6
Sources of modulation and receptive fields of F- and E-neurons in control and at different time points after spinalization. Percentage of F-neurons (A) and E-neurons (B) receiving different combinations of tilt-related somatosensory inputs from the limbs (Types 1–4) in control (Contr), after acute spinalization (Acute) and on 3rd day (3 days), 7th day (7 days), 30th day (30 days) after spinalization. See text for explanation. (C) Proportion of neurons receiving sensory inputs from different sources, i.e., from receptors of only one muscle (1 muscle), from receptors of more than one muscle (>1 muscle), from cutaneous and muscle receptors (Skin/fur + muscle), from cutaneous receptors only (Skin/fur), and with no receptive field found (Not found) in control, after acute spinalization, on 3rd and 30th day after spinalization. See text for explanation. (D) Proportion of neurons in which response to tilts could be completely explained (Expl), partly explained (Partly expl) and could not be explained (Not expl) by input from their receptive field, in control, after acute spinalization, on 3rd and 30th day after spinalization.
FIGURE 7
FIGURE 7
The efficacy of tilt-related sensory inputs from the ipsilateral and contralateral limbs to F- and to E-neurons in control and at different time points after spinalization. (A,B) The mean and SEM. values of the depth of modulation of F-neurons recorded in control, after acute spinalization and on 3rd day, 7th day, and 30th day after spinalization during tilts of the ipsilateral (A) and contralateral (B) limbs. The numbers of F-neurons from zones 1, 2, 3 subjected to these tests were: in control animals – n = 42, 62, 71, respectively; in animals after acute spinalization – n = 28, 41, 33, respectively; in animals on 3rd day after spinalization – n = 12, 24, 31, respectively; in animals on 7th day after spinalization – n = 23, 32, 31, respectively; in animals on 30th day after spinalization – n = 18, 35, 31, respectively. (C,D) The mean and SEM. values of the depth of modulation of E-neurons recorded in control, after acute spinalization and on 3rd day, 7th day, and 30th day after spinalization during tilts of the ipsilateral (C) and contralateral (D) limbs. The numbers of E-neurons from zones 1, 2, 3 subjected to these tests were: in control animals – n = 32, 45, 55, respectively; in animals after acute spinalization – n = 25, 67, 17, respectively; in animals on 3rd day after spinalization – n = 8, 34, 24, respectively; in animals on 7th day after spinalization – n = 16, 16, 29, respectively; in animals on 30th day after spinalization – n = 20, 30, 23, respectively. Designations are the same as in Figure 4. Indication of significance level: p < 0.05, ∗∗p < 0.01, and ∗∗∗p < 0.001.
FIGURE 8
FIGURE 8
Oscillatory component in activity of F-, E-, and non-modulated neurons during tilts of the whole platform in control and at different time points after spinalization. The mean and SE values of the amplitude of the oscillatory component of activity (A,C,E) and the relative power of the oscillatory componet (B,D,F) of F-neurons (A,B), E-neurons (C,D), and non-modulated (NM) neurons (E,F) in control (Control), after acute spinalization (Acute), and on 3rd, 7th, and 30th days after spinalization (3, 7, and 30 days, respectively). Designations and numbers of neurons are the same as in Figure 4. Indication of significance level: p < 0.05, ∗∗p < 0.01, and ∗∗∗p < 0.001.

Similar articles

Cited by

References

    1. Ashby P., Verrier M. (1975). Neurophysiological changes following spinal cord lesions in man. Can. J. Neural. Sci. 2 91–100. 10.1017/s0317167100020060 - DOI - PubMed
    1. Bannatyne B. A., Edgley S. A., Hammar I., Jankowska E., Maxwell D. J. (2003). Networks of inhibitory and excitatory commissural interneurons mediating crossed reticulospinal actions. Eur. J. Neurosci. 18 2273–2284. 10.1046/j.1460-9568.2003.02973.x - DOI - PMC - PubMed
    1. Bannatyne B. A., Edgley S. A., Hammar I., Stecina K., Jankowska E., Maxwell D. J. (2006). Different projections of excitatory and inhibitory dorsal horn interneurons relaying information from group II muscle afferents in the cat spinal cord. J. Neurosci. 26 2871–2880. 10.1523/jneurosci.5172-05.2006 - DOI - PMC - PubMed
    1. Bannatyne B. A., Liu T. T., Hammar I., Stecina K., Jankowska E., Maxwell D. J. (2009). Excitatory and inhibitory intermediate zone interneurons in pathways from feline group I and II afferents: differences in axonal projections and input. J. Physiol. 587 379–399. 10.1113/jphysiol.2008.159129 - DOI - PMC - PubMed
    1. Barbeau H., Fung J., Leroux A., Ladouceur M. (2002). A review of the adaptability and recovery of locomotion after spinal cord injury. Prog. Brain Res. 137 9–25. 10.1016/s0079-6123(02)37004-3 - DOI - PubMed

LinkOut - more resources