

Performance Expectancies Moderate the Effectiveness of More or Less Generative Activities Over Time
- PMID: 31496963
- PMCID: PMC6713021
- DOI: 10.3389/fpsyg.2019.01623
Performance Expectancies Moderate the Effectiveness of More or Less Generative Activities Over Time
Abstract
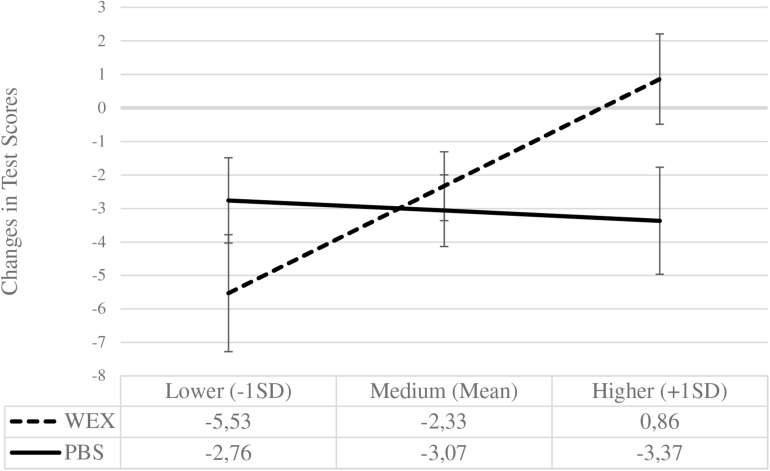
We examined if the benefits of generation for long-term learning depend on individual differences in performance expectancies (PEs) prior to learning. We predicted that a greater generative activity (problem-solving) compared to less generative activity (worked-examples) should be more effective for pupils with higher PEs, especially in the long run. As a comparison group for problem-solving, we implemented a special type of worked-examples that decreased engaging in self-explanations, because our main prediction focused on PEs moderating the long-term effectivity of less versus greater generative activities. We tested students' immediate and delayed performance (after 3 months) using coherent curricular materials on linear functions in a sample of eighth graders (advanced school track). The results were partly in line with our predictions: Although we found no moderation of PE and generative activity, we obtained the predicted 3-way interaction of PE, generative activity, and time. Immediately, greater generative activity (problem-solving) was beneficial for pupils with higher PEs, while for pupils with lower PEs, problem-solving versus worked-examples did not differ. In the delayed test, this pattern reversed: for lower PEs, greater generative activity outperformed less generative activities, but there was no difference for higher PEs. Unexpectedly, the initial advantage of problem-solving for higher PEs could not be maintained, decreasing over three subsequent months, whereas the performance in the worked-example condition remained at a comparable level for higher PEs. The change in performance in the problem-solving condition for lower PEs was descriptively less pronounced than in the worked-example condition, but statistically not different. We further investigated the effects of problem-solving and worked-examples on changes in PEs after learning and after testing, hinting at gradual decrease in PEs and greater metacognitive accuracy in the problem-solving condition due to a reduction of overconfidence.
Keywords: desirable difficulties; generation effect; long-term learning; meta-cognition; performance expectancies; problem-solving; worked-examples.
Figures


References
-
- Adesope O. O., Trevisan D. A., Sundararajan N. (2017). Rethinking the use of tests: a meta-analysis of practice testing. Rev. Educ. Res. 87 659–701. 10.3102/0034654316689306 - DOI
-
- Agarwal P. K., Karpicke J. D., Kang S. H., Roediger H. L., McDermott K. B. (2008). Examining the testing effect with open-and closed-book tests. Appl. Cogn. Psychol. 22 861–876. 10.1002/acp.1391 - DOI
-
- Ajzen I., Fishbein M. (1988). Theory of Reasoned Action-Theory of Planned Behavior. Tampa, FL: University of South Florida.
-
- Baars M., Gog T., Bruin A., Paas F. (2014). Effects of problem solving after worked example study on primary school children’s monitoring accuracy. Appl. Cogn. Psychol. 28 382–391. 10.1002/acp.3008 - DOI
-
- Baars M., Van Gog T., de Bruin A., Paas F. (2016). Effects of problem solving after worked example study on secondary school children’s monitoring accuracy. Educ. Psychol. 37 810–834. 10.1080/01443410.2016.1150419 - DOI
LinkOut - more resources
Full Text Sources
Research Materials