. 2019 Aug 21:10:554.
doi: 10.3389/fendo.2019.00554. eCollection 2019.

Time-Restricted Feeding Improves Glucose Tolerance in Rats, but Only When in Line With the Circadian Timing System

Affiliations

Time-Restricted Feeding Improves Glucose Tolerance in Rats, but Only When in Line With the Circadian Timing System

Paul de Goede et al. Front Endocrinol (Lausanne). .

Abstract

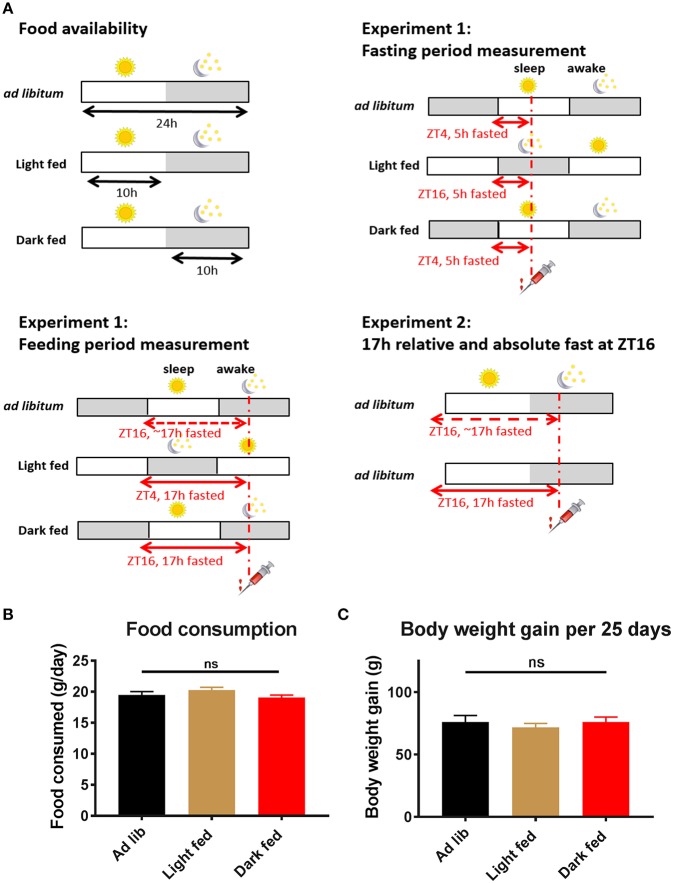
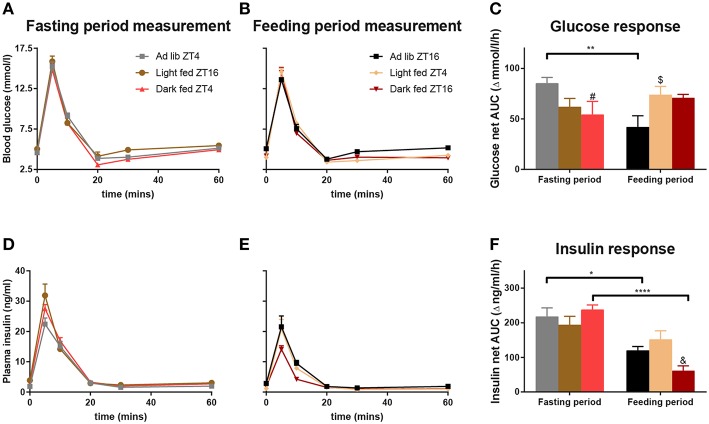
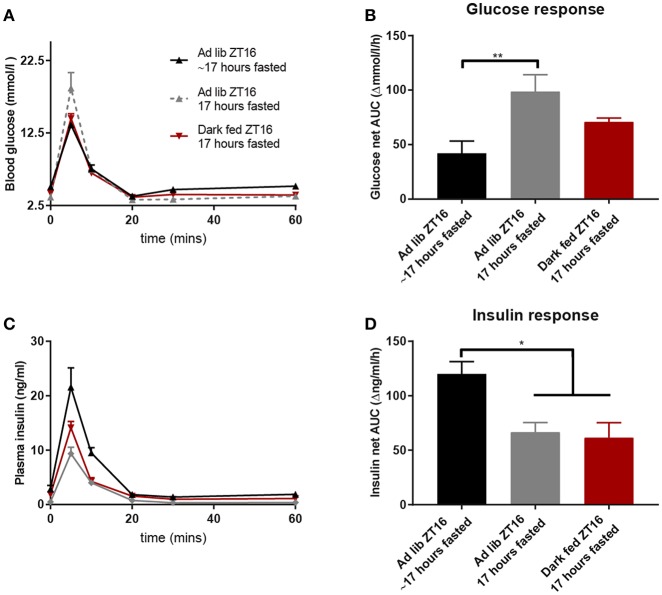
Epidemiological studies indicate that shift-workers have an increased risk of type 2 diabetes mellitus (T2DM). Glucose tolerance and insulin sensitivity both are dependent on the circadian timing system (i.e., the time-of-day) and fasting duration, in rodents as well as humans. Therefore, question is whether manipulation of the circadian timing system, for example by changing the timing of feeding and fasting, is a potential preventive treatment for T2DM. Time-restricted feeding (TRF) is well-known to have profound effects on various metabolic measures, including glucose metabolism. However, experiments that directly measure the effects of TRF on glucose tolerance and/or insulin sensitivity at different time points throughout the 24 h cycle are lacking. Here we show, in rats, that TRF in line with the circadian timing system (i.e., feeding during the active phase) improves glucose tolerance during intravenous glucose tolerance tests (ivGTT) in the active phase, as lower insulin levels were observed with similar levels of glucose clearance. However, this was not the case during the inactive phase in which more insulin was released but only a slightly faster glucose clearance was observed. Contrasting, TRF out of sync with the circadian timing system (i.e., feeding during the inactive phase) worsened glucose tolerance, although only marginally, likely because of adaptation to the 4 week TRF regimen. Our results show that TRF can improve glucose metabolism, but strict adherence to the time-restricted feeding period is necessary, as outside the regular eating hours glucose tolerance is worsened.

Keywords: Type 2 diabetes mellitus (T2DM); feeding behavior; insulin sensitivity; intravenous glucose tolerance test (ivGTT); metabolism; shift-work.


Figures

Figure 1
Figure 1
Experimental design and basic physiological measures of the rats. (A) Experimental design of Experiment-1 and Experiment-2. Time-restricted fed animals had daily access to chow pellets for 10 h during either the light phase (ZT1-11) or the dark phase (ZT13-23). Three and four weeks after the start of the TRF protocol an intravenous glucose tolerance test (ivGTT) was performed. On these experimental days an ivGTT was performed at ZT4 or ZT16, during which blood samples were taken just before a glucose bolus injection at t = 0 as well as at t = 5, 10, 20, 30, and 60 min. All animals were fasted for at least 5 h on the experimental days, but as TRF animals remained on their assigned Feeding regimen during the experimental days they were effectively fasted for 17 h during the Feeding period measurement (i.e., dark fed animals were 17 h fasted during the measurement at ZT16, whilst light fed animals were fasted for 17 h during the measurement at ZT4). (B) Daily food consumption in the test weeks did not significantly differ between the 3 experimental groups (average of 2 days in week 3 and 2 days in week 4, p = 0.23; one-way ANOVA, n = 14–16 per group). (C) Body weight gain in the period between the start of the TRF regimen and the 4th week of the TRF protocol did not significantly differ between the 3 groups (p = 0.73; one-way ANOVA, n = 14–16 per group).
Figure 2
Figure 2
Glucose and insulin values during the ivGTTs at ZT4 and ZT16. By experimental design at any given ZT point light-TRF and dark-TRF animals always differ in their fasting status. Therefore, we chose to display the results of the ivGTT's not by ZT but according to the Feeding status of the animals. Thus, ivGTT's performed during the Feeding period are labeled “Feeding period measurements,” i.e., ZT16 for ad libitum and dark fed animals and ZT4 for the light fed animals. ivGTT's performed during the fasting period are labeled “Fasting period measurements,” i.e., ZT4 for the ad libitum and dark fed animals and ZT16 for the light fed animals. (A,B,D,E) Blood glucose and plasma insulin values during the ivGTT in the Fasting period (A,D) and during the Feeding period (B,E). (C,F) Net AUC (i.e., negative AUC [“undershoot”] subtracted from the positive AUC) of glucose and insulin responses, respectively. AUC values of glucose and insulin are displayed relative to their respective baseline value. Table 1 summarizes the main statistical findings for all glucose and insulin measures during the GTTs. N = 8–13 animals per experimental group per measurement. *p < 0.05, **p < 0.01, ****p < 0.0001, #, significant difference between the Ad lib and Dark fed group; $, significant difference between the Ad lib and Light fed groups; &, significant difference between the Dark and Light fed group.
Figure 3
Figure 3
Glucose and insulin values during the ZT16 ivGTT of the 3 groups that were fasted for 17 h [either absolute or relative (~)]: the d-TRF group, the Ad lib group from Experiment-1 that was relatively fasted for ~17 h and the absolute 17 h fasted Ad lib animals from Experiment-2. (A,C) Glucose and insulin values during the ivGTT. (B,D) Net AUC (i.e., negative AUC [“undershoot”] subtracted from the positive AUC) of glucose and insulin responses, respectively. N = 8–9 animals per experimental group. *p < 0.05, **p < 0.01.

References

    1. Emerging Risk Factors Collaboration. Sarwar N, Gao P, Seshasai SRK, Gobin R, Kaptoge S, et al. . Diabetes mellitus, fasting blood glucose concentration, and risk of vascular disease: a collaborative meta-analysis of 102 prospective studies. Lancet. (2010) 375:2215–22. 10.1016/S0140-6736(10)60484-9 - DOI - PMC - PubMed
    1. Knutsson A, Kempe A. Shift work and diabetes – A systematic review. Chronobiol Int. (2014) 31:1146–51. 10.3109/07420528.2014.957308 - DOI - PubMed
    1. Shetty A, Hsu JW, Manka PP, Syn W-K. Role of the circadian clock in the metabolic syndrome and nonalcoholic fatty liver disease. Dig Dis Sci. (2018) 63:3187–206. 10.1007/s10620-018-5242-x - DOI - PubMed
    1. Opperhuizen A-L, van Kerkhof LWM, Proper KI, Rodenburg W, Kalsbeek A. Rodent models to study the metabolic effects of shiftwork in humans. Front Pharmacol. (2015) 6:1–20. 10.3389/fphar.2015.00050 - DOI - PMC - PubMed
    1. Longo VD, Panda S. Fasting, circadian rhythms, and time-restricted feeding in healthy lifespan. Cell Metab. (2016) 23:1048–59. 10.1016/j.cmet.2016.06.001 - DOI - PMC - PubMed

LinkOut - more resources