

Different Features of Tumor-Associated NK Cells in Patients With Low-Grade or High-Grade Peritoneal Carcinomatosis
- PMID: 31497016
- PMCID: PMC6712073
- DOI: 10.3389/fimmu.2019.01963
Different Features of Tumor-Associated NK Cells in Patients With Low-Grade or High-Grade Peritoneal Carcinomatosis
Abstract
Peritoneal carcinomatosis (PC) is a rare disease defined as diffused implantation of neoplastic cells in the peritoneal cavity. This clinical picture occurs during the evolution of peritoneal tumors, and it is the main cause of morbidity and mortality of patients affected by these pathologies, though cytoreductive surgery with heated intra-peritoneal chemotherapy (CRS/HIPEC) is yielding promising results. In the present study, we evaluated whether the tumor microenvironment of low-grade and high-grade PC could affect the phenotypic and functional features and thus the anti-tumor potential of NK cells. We show that while in the peritoneal fluid (PF) of low-grade PC most CD56dim NK cells show a relatively immature phenotype (NKG2A+KIR-CD57-CD16dim), in the PF of high-grade PC NK cells are, in large majority, mature (CD56dimKIR+CD57+CD16bright). Furthermore, in low-grade PC, PF-NK cells are characterized by a sharp down-regulation of some activating receptors, primarily NKp30 and DNAM-1, while, in high-grade PC, PF-NK cells display a higher expression of the PD-1 inhibitory checkpoint. The compromised phenotype observed in low-grade PC patients corresponds to a functional impairment. On the other hand, in the high-grade PC patients PF-NK cells show much more important defects that only partially reflect the compromised phenotype detected. These data suggest that the PC microenvironment may contribute to tumor escape from immune surveillance by inducing different NK cell impaired features leading to altered anti-tumor activity. Notably, after CRS/HIPEC treatment, the altered NK cell phenotype of a patient with a low-grade disease and favorable prognosis was reverted to a normal one. Our present data offer a clue for the development of new immunotherapeutic strategies capable of restoring the NK-mediated anti-tumor responses in association with the CRS/HIPEC treatment to increase the effectiveness of the current therapy.
Keywords: NK cell receptors; NKp30; PD-1/PD-L; human NK cells; immune checkpoint; immune escape; peritoneal carcinomatosis; pseudomyxoma peritonei.
Figures
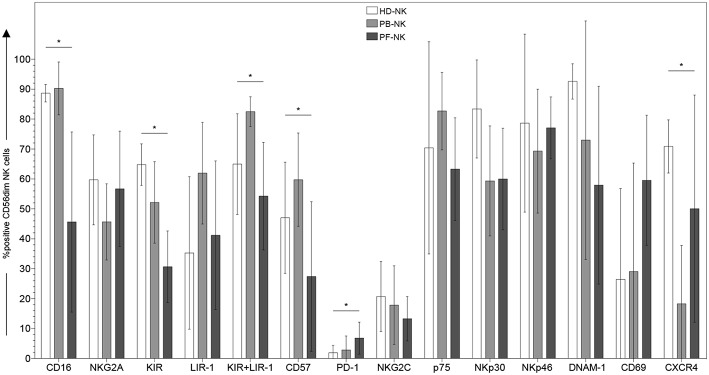
 bars), peripheral blood of PC patients (PB-NK) (
 bars) (n = 8: Pt. 1, Pt. 2, Pt. 3, Pt. 4, Pt. 6, Pt. 7, Pt. 8, Pt. 9) and peritoneal fluid of PC patients (PF-NK) (
 bars) (n = 6: Pt. 1, Pt. 2, Pt. 3, Pt. 4, Pt. 6, Pt. 8). Histograms indicate the percent ±SD of HD-/PB-/PF-NK cells positive for the indicated receptors. In order to compare the expression of the three groups simultaneously (i.e., HD-NK, PB-NK, and PF-NK), we computed the Krustall rank sum tests for each cell surface marker analyzed. *P < 0.05.
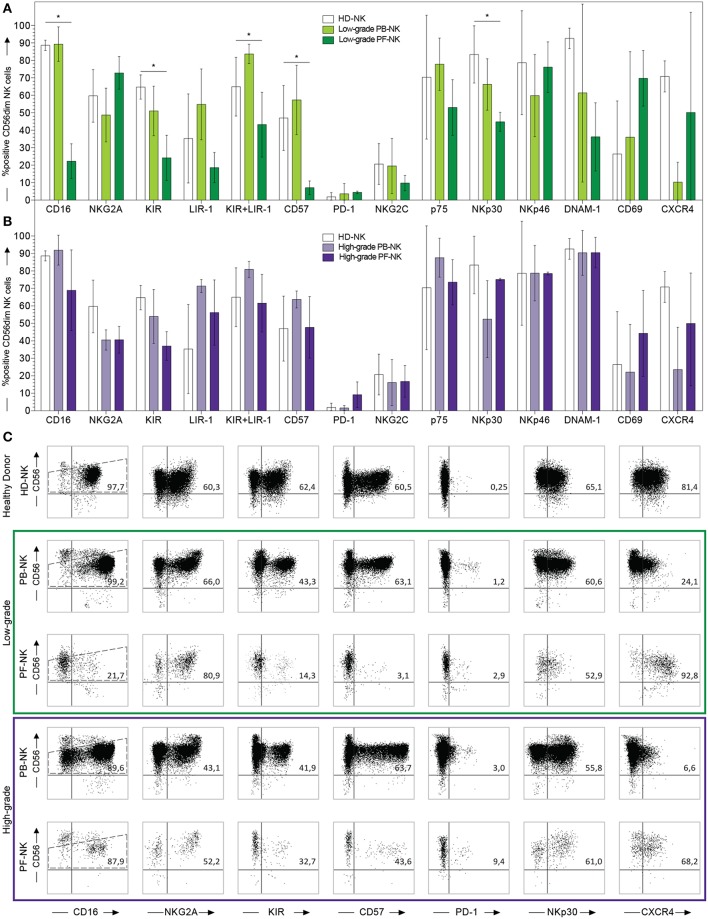 bars) (n = 6), PB-NK of low-grade PC patients (
 bars) (n = 5: Pt. 1, Pt. 6, Pt. 7, Pt. 8, Pt. 9) and PF-NK of low-grade PC patients (
 bars) (n = 3: Pt. 1, Pt. 6, Pt. 8) (A). Cytofluorimetric analysis of the expression of a panel of cell surface markers on HD-NK ( bars) (n = 6), PB-NK of high-grade PC patients (
 bars) (n = 3: Pt. 2, Pt. 3, Pt. 4) and PF-NK of high-grade PC patients (
 bars) (n = 3: Pt. 2, Pt. 3, Pt. 4) (B). Cells are gated on CD56dim NK cells. In order to compare the expression of the three groups simultaneously (i.e., HD-NK, PB-NK, and PF-NK), we computed the Krustall rank sum tests for each cell surface marker analyzed. *P < 0.05. (A,B) Dot plots derived from a representative healthy donor (HD-NK), a representative low-grade PC patient (PB-NK/PF-NK) and a representative high-grade PC patient (PB-NK/PF-NK) are shown. Percentages of positive NK cells (gated on CD56dim subset as indicated by the dotted line) for the indicated receptors are reported in the upper right quadrant of each dot plot (C).
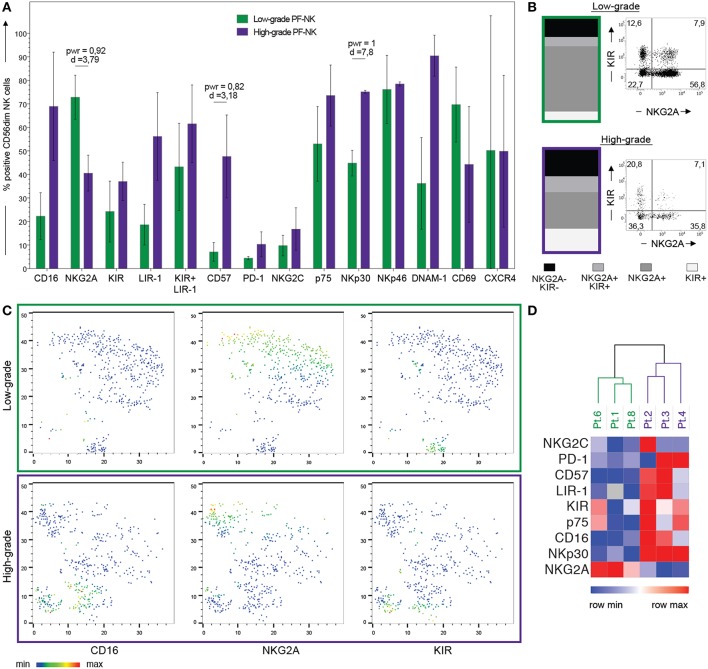
 bars) (n = 3:Pt. 1, Pt. 6, Pt. 8) and PF-NK derived from high-grade PC patients (high-grade PF-NK) (
 bars) (n = 3: Pt. 2, Pt. 3, Pt. 4). The power (pwr) and Cohen's distance (d), calculated with the Power Analysis for Two-group Independent sample t-test, of the pair are indicated when significant (power ≥ 0,8) (A). Distribution of KIR and NKG2A receptors on gated CD56dim NK cells of low-grade PC patients and high-grade PC patients. A representative donor is shown for each group of patients (B). t-SNE clusterization of CD56dim PF-NK cells derived from a representative low-grade PC patient (Pt. 6) and a representative high-grade PC patient (Pt. 4). The color scale represents the different distribution of CD16, NKG2A, and KIR receptors evaluated through the variation of Geo-mean (C). Heatmap showing the clustering of low-grade (Pt. 1, Pt. 6, Pt. 8) and high-grade (Pt. 2, Pt. 3, Pt. 4) PC patients based on the differential expression of the indicated NK cell receptors on gated CD56dim NK cells. The color scale goes from blue (low relative expression) to red (high relative expression) and it is based on the variation of each single receptor through the six patients (D).
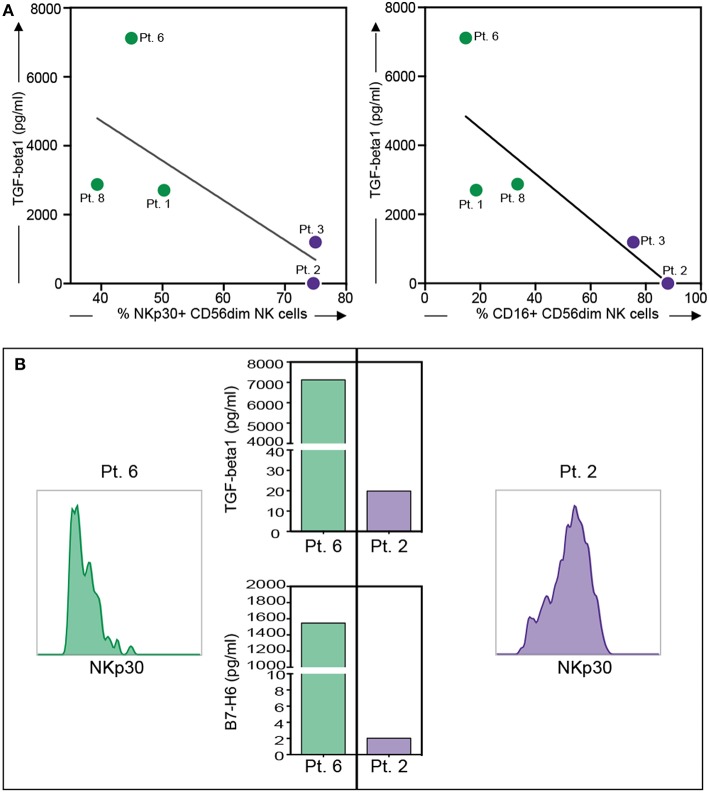
 dots, n = 3: Pt. 1, Pt. 6, Pt. 8) or high-grade PC patients (
 dots, n = 2: Pt. 2, Pt.3). The linear regression line is shown (NKp30 vs. TGF-beta1: R = 0.52 and p = 0.17; CD16 vs. TGF-beta1: R = 0.68 and p = 0.09) (A). Histograms showing the expression of NKp30 on PF-NK cells of a representative low-grade PC patient (Pt. 6) and a representative high-grade PC patient (Pt. 2) and TGF-beta1/sB7-H6 concentration in PF of the same patients (B).
References
-
- Carr NJ, Cecil TD, Mohamed F, Sobin LH, Sugarbaker PH, Gonzalez-Moreno S, et al. . A Consensus for classification and pathologic reporting of pseudomyxoma peritonei and associated appendiceal neoplasia: the results of the peritoneal surface oncology group international (PSOGI) modified delphi process. Am J Surg Pathol. (2016) 40:14–26. 10.1097/PAS.0000000000000535 - DOI - PubMed
-
- Carr NJ, Bibeau F, Bradley RF, Dartigues P, Feakins RM, Geisinger KR, et al. . The histopathological classification, diagnosis and differential diagnosis of mucinous appendiceal neoplasms, appendiceal adenocarcinomas and pseudomyxoma peritonei. Histopathology. (2017) 71:847–58. 10.1111/his.13324 - DOI - PubMed