. 2019 Aug 21:10:1983.
doi: 10.3389/fimmu.2019.01983. eCollection 2019.

HIV Infection Is Associated With Downregulation of BTLA Expression on Mycobacterium tuberculosis-Specific CD4 T Cells in Active Tuberculosis Disease

Affiliations

HIV Infection Is Associated With Downregulation of BTLA Expression on Mycobacterium tuberculosis-Specific CD4 T Cells in Active Tuberculosis Disease

Morgan S Barham et al. Front Immunol. .

Abstract

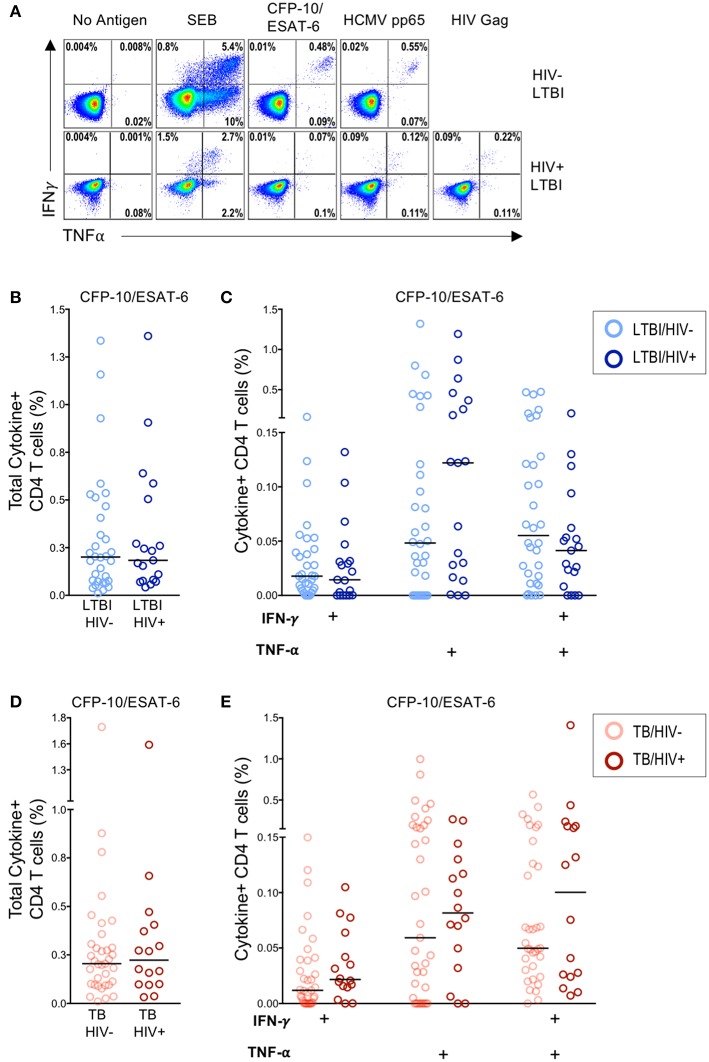
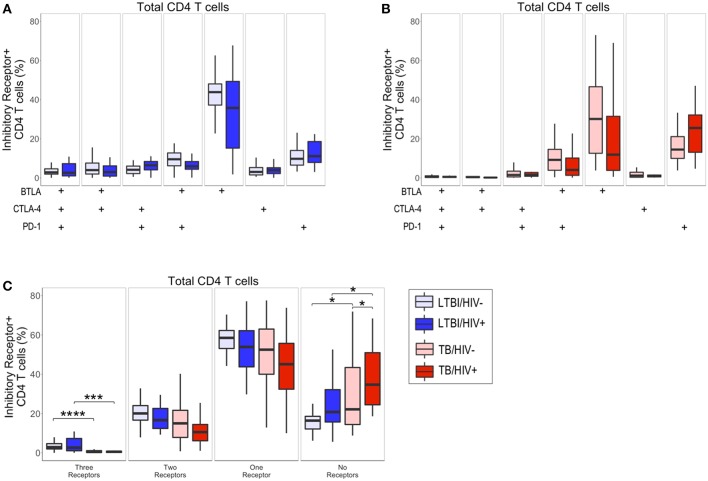
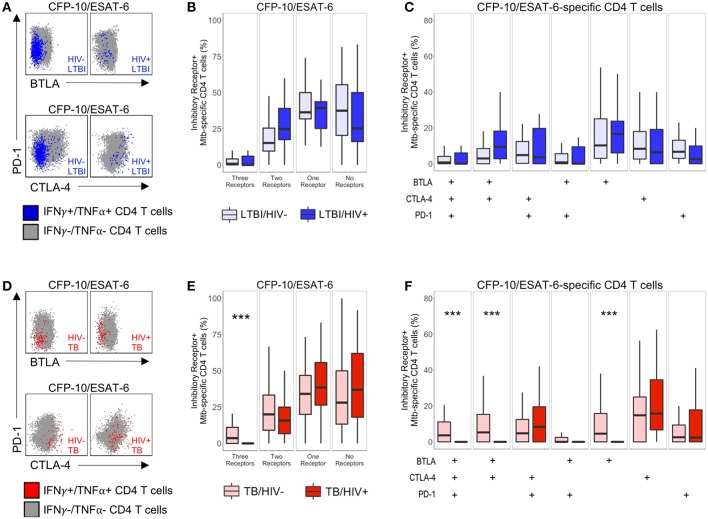
Nearly a quarter of the global population is infected with Mycobacterium tuberculosis (Mtb), with 10 million people developing active tuberculosis (TB) annually. Co-infection with human immunodeficiency virus (HIV) has long been recognized as a significant risk factor for progression to TB disease, yet the mechanisms whereby HIV impairs T cell-mediated control of Mtb infection remain poorly defined. We hypothesized that HIV infection may promote upregulation of inhibitory receptors on Mtb-specific CD4 T cells, a mechanism that has been associated with antigen-specific T cell dysfunction in chronic infections. Using cohorts of HIV-infected and HIV-uninfected individuals with latent Mtb infection (LTBI) and with active TB disease, we stimulated peripheral blood mononuclear cells (PBMC) for 6 hours with Mtb peptide pools and evaluated co-expression profiles of the inhibitory receptors BTLA, CTLA-4, and PD-1 on IFN-γ+/TNF-α+ Mtb-specific CD4 T cells. Mtb-specific CD4 T cells in all participant groups expressed predominately either one or no inhibitory receptors, unlike cytomegalovirus- and HIV-specific CD4 T cells circulating in the same individuals, which were predominately CTLA-4+PD-1+. There were no significant differences in inhibitory receptor expression profiles of Mtb-specific CD4 T cells between HIV-uninfected and HIV-infected individuals with LTBI. Surprisingly, BTLA expression, both alone and in combination with CTLA-4 and PD-1, was markedly downregulated on Mtb-specific CD4 T cells in HIV-infected individuals with active TB. Together, these data provide novel evidence that the majority of Mtb-specific CD4 T cells do not co-express multiple inhibitory receptors, regardless of HIV infection status; moreover, they highlight a previously unrecognized role of BTLA expression on Mtb-specific CD4 T cells that could be further explored as a potential biomarker of Mtb infection status, particularly in people living with HIV, the population at greatest risk for development of active TB disease.

Keywords: BTLA; CD4 T cell; CTLA-4; HIV; LTBI; Mycobacterium tuberculosis; PD-1; active TB disease.


Figures

Figure 1
Figure 1
Similar frequencies of Mtb-specific T cells producing IFN-γ and TNF-α in HIV-infected and HIV-uninfected individuals with latent and active TB. PBMC from HIV-uninfected (n = 32) and HIV-infected (n = 22) individuals with LTBI and HIV-uninfected (n = 37) and HIV-infected (n = 19) individuals with active TB were incubated for 6 h in media alone (negative control) or stimulated with Ags (CFP-10/ESAT-6 peptide pools, HCMV pp65 peptide pool, HIV Gag peptide pool, and SEB). Intracellular expression of IFN-γ and TNF-α was measured by flow cytometry. (A) Representative flow cytometry data from an HIV-uninfected individual with LTBI (top row), and an HIV-infected individual with LTBI (bottom row). Plots are shown gated on live CD3+CD4+ lymphocytes. (B) Total frequency of cytokine+ Mtb-specific CD4 T cells from HIV-uninfected and HIV-infected individuals with LTBI. (C) Frequencies of the indicated cytokine+ subsets of Mtb-specific CD4 T cells from HIV-uninfected and HIV-infected individuals with LTBI. (D) Total frequency of cytokine+ Mtb-specific CD4 T cells from HIV-uninfected and HIV-infected individuals with active TB. (E) Frequencies of the indicated cytokine+ subsets of Mtb-specific CD4 T cells in HIV-uninfected and HIV-infected individuals with active TB. Horizontal lines represent the median. Data are shown after subtraction of background cytokine production in the unstimulated negative control condition. Differences in the frequencies of each cytokine+ T cell population between HIV-uninfected and HIV-infected individuals were assessed using a Mann Whitney U test.
Figure 2
Figure 2
Active TB disease is associated with reduced inhibitory receptor co-expression on total CD4 T cells. PBMC from HIV-uninfected and HIV-infected individuals with LTBI (n = 32 and n = 22, respectively) and active TB (n = 37 and n = 19, respectively) were analyzed by flow cytometry for expression of the inhibitory receptors BTLA, CTLA-4, and PD-1 on total CD4 T cells. (A,B) The frequencies of total CD4 T cells expressing each combination of BTLA, CTLA-4, and PD-1 are shown for individuals with LTBI (A) and active TB (B). (C) Summary data representing the proportion of total CD4 T cells expressing three, two, one, or no inhibitory receptors from HIV-uninfected and HIV-infected individuals with LTBI and active TB. Boxes represent the median and interquartile ranges; whiskers represent the 5th and 95th percentiles. Differences in the proportion of CD4 T cells expressing each inhibitory receptor population between HIV-uninfected and HIV-infected individuals (A,B) were assessed using a Mann-Whitney U test. Differences among groups in the number of inhibitory receptors expressed by CD4 T cells in panel C were assessed using a Kruskal-Wallis test, with p-values adjusted for multiple comparisons using Dunn's post-test. *p < 0.05; ***p < 0.001; ****p < 0.0001.
Figure 3
Figure 3
Modulation of Mtb-specific CD4 T cell inhibitory receptor expression profiles in HIV-infected individuals with active TB. PBMC from HIV-uninfected and HIV-infected individuals were stimulated with CFP-10 and ESAT-6 peptide pools and evaluated for expression of IFN-γ and TNF-α by flow cytometry, as described in Figure 1. Mtb-specific CD4 T cells meeting the criteria for a positive response (see Materials and Methods) were evaluated for expression of BTLA, CTLA-4, and PD-1. (A,D) Representative flow cytometry data of BTLA, CTLA-4, and PD-1 expression are shown from an HIV-uninfected and HIV-infected individual with LTBI (A) and active TB (D). Flow plots are shown gated on live CD3+CD4+ lymphocytes. Gray dots represent the total cytokine-negative CD4 T cell population; blue and red dots represent IFN-γ and/or TNF-α producing CD4 T cells from individuals with LTBI and TB, respectively. (B,E) Composite data from individuals with LTBI (B) and TB (E) indicating the proportion of CFP-10/ESAT-6-specific CD4 T cells expressing three, two, one or no inhibitory receptors. (C,F) Composite data from individuals with LTBI (C) and TB (F) indicating the proportion of CFP-10/ESAT-6-specific CD4 T cells expressing the indicated combinations of BTLA, PD-1, and CTLA-4 (LTBI/HIV, n = 27; LTBI/HIV+, n = 17; TB/HIV, n = 35; TB/HIV+, n = 16). Boxes represent the median and interquartile ranges; whiskers represent the 5th and 95th percentiles. Differences in the proportions of Mtb-specific CD4 T cells expressing the indicated inhibitory receptors between HIV-uninfected and HIV-infected individuals were assessed using a Mann-Whitney U test. ***p < 0.001.
Figure 4
Figure 4
HIV infection is associated with downregulation of BTLA expression on total CD4 T cells and Mtb-specific CD4 T cells in active TB. PBMC from HIV-uninfected and HIV-infected individuals with LTBI and TB were evaluated for BTLA expression by flow cytometry. (A) Flow plots are shown gated on live CD3+CD4+ lymphocytes. (B) Summary of BTLA expression on total unstimulated CD4 T cells from HIV-uninfected and HIV-infected individuals with LTBI and active TB. (C) Representative flow data of PBMC following stimulation with CFP-10/ESAT-6 peptide pools, as described in Figure 1. Cells were gated on live CD3+CD4+IFN-γ+ T cells, then evaluated for BTLA expression. (D) Summary of BTLA expression on CFP-10/ESAT-6-specific CD4 T cells from HIV-uninfected and HIV-infected individuals with LTBI and active TB. Boxes in panels B and D represent the median and interquartile ranges; whiskers represent the 5th and 95th percentiles. Differences in BTLA expression among groups in (B,D) were assessed using a Kruskal-Wallis test, with p-values adjusted for multiple comparisons using Dunn's post-test. *p < 0.05, ****p < 0.0001.
Figure 5
Figure 5
Differential inhibitory receptor expression profiles on Mtb-specific CD4 T cells, compared with HCMV- and HIV-specific CD4 T cells within the same individuals. PBMC were stimulated with CFP-10 and ESAT-6 peptide pools as described in Figure 1, as well as HCMV pp65 peptide pool and HIV Gag peptide pool. Ag-specific CD4 T cells meeting the criteria for a positive response (see Materials and Methods) were evaluated for expression of BTLA, CTLA-4, and PD-1. (A) Representative intracellular cytokine staining flow cytometry data from an HIV-infected individual with LTBI. Plots are shown gated on live CD3+CD4+ lymphocytes. Gray dots represent cytokine-negative CD4 T cells; blue dots represent IFN-γ+ and/or TNF-α+ CD4 T cells. (B,C) Summary data of the proportion of Ag-specific CD4 T cells expressing the indicated subsets of inhibitory receptors (B) and the proportion of Ag-specific CD4 T cells expressing three, two, one, or no inhibitory receptors (C) in individuals with LTBI (top row, HIV-uninfected LTBI; bottom row, HIV-infected LTBI). (D,E) Summary data of the proportion of Ag-specific CD4 T cells expressing the indicated subsets of inhibitory receptors (D) and the proportion of Ag-specific CD4 T cells expressing three, two, one, or no inhibitory receptors (E) in individuals with active TB (top row, HIV-uninfected TB; bottom row, HIV-infected TB). Boxes represent the median and interquartile ranges; whiskers represent the 5th and 95th percentiles. Differences between Mtb- and HCMV-specific CD4 T cells in HIV-uninfected individuals (B,D) were assessed using a Mann-Whitney U test. Differences between Mtb-specific and HCMV- and HIV-specific CD4 T cells in HIV-infected individuals (B,D) were assessed using a Kruskal-Wallis test, with p-values adjusted for multiple comparisons using Dunn's post-test. *p < 0.05; **p < 0.01; ***p < 0.001; ****p <0.0001.

References

    1. WHO Publication. Global Tuberculosis Report 2018. (2018). Available online at: http://www.who.int/tb/publications/global_report/en/ (accessed February 5, 2019).
    1. Houben RM, Dodd PJ. The global burden of latent tuberculosis infection: a re-estimation using mathematical modelling. PLoS Med. (2016) 13:e1002152. 10.1371/journal.pmed.1002152 - DOI - PMC - PubMed
    1. Lawn SD, Zumla AI. Tuberculosis. Lancet. (2011) 378:57–72. 10.1016/S0140-6736(10)62173-3 - DOI - PubMed
    1. Ernst JD. The immunological life cycle of tuberculosis. Nat Rev Immunol. (2012) 12:581–91. 10.1038/nri3259 - DOI - PubMed
    1. Day CL, Abrahams DA, Harris LD, van Rooyen M, Stone L, de Kock M, et al. . HIV-1 infection is associated with depletion and functional impairment of Mycobacterium tuberculosis-specific CD4 T cells in individuals with latent tuberculosis infection. J Immunol. (2017) 199:2069–80. 10.4049/jimmunol.1700558 - DOI - PMC - PubMed

Publication types