. 2019 Aug 21:10:2003.
doi: 10.3389/fimmu.2019.02003. eCollection 2019.

Airway CD8+CD161++TCRvα7.2+ T Cell Depletion During Untreated HIV Infection Targets CD103 Expressing Cells

Affiliations

Airway CD8+CD161++TCRvα7.2+ T Cell Depletion During Untreated HIV Infection Targets CD103 Expressing Cells

Leonard Mvaya et al. Front Immunol. .

Abstract

HIV-infected adults are at an increased risk to lower respiratory tract infections (LRTIs). CD8+CD161++TCRvα7.2+ T cells are an innate-like T cell subset that are thought to play an important role in early defense against pathogens in the respiratory tract. HIV infection leads to irreversible depletion of these cells in peripheral blood, however, its impact on this subset in the human airway is still unclear. Here, we show presence of CD103 expressing CD8+CD161++TCRvα7.2+ T cells in the airway that exhibited a distinct cytokine functional profile compared to their CD103- airway counterparts and those from peripheral blood. These CD103 expressing airway CD8+CD161++TCRvα7.2+ T cells were selectively depleted in untreated HIV-infected adults compared to healthy controls. Their frequency was positively correlated with frequency of airway CD4+ T cells. Furthermore, the frequency of airway CD8+CD161++TCRvα7.2+ T cells was also inversely correlated with HIV plasma viral load, while suppressive antiretroviral therapy (ART) resulted in restoration of airway CD8+CD161++TCRvα7.2+ T cells. Our findings show that CD103 expressing airway CD8+CD161++TCRvα7.2+ T cells are functionally distinct and are preferentially depleted during untreated asymptomatic HIV infection. Depletion of CD103 expressing airway CD8+CD161++TCRvα7.2+ T cells, at a major portal of pathogen entry, could partly contribute to the increased propensity for opportunistic LRTIs observed in untreated HIV-infected adults.

Keywords: CD103; CD8 T cell; HIV; adult; airway.


Figures
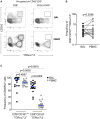
Figure 1
Figure 1
Identification of CD8+CD161++TCRvα7.2+ T cells in airway lumen and peripheral circulation. BAL cells and PBMCs from HIV-uninfected adults were stained with fluorochrome-conjugated antibodies against surface markers of interest. (A) Representative flow cytometry plots showing CD8+CD161++TCRvα7.2+ T cells in matched BAL and PBMC samples from a healthy HIV-uninfected adult. (B) Frequency of CD8+CD161++TCRvα7.2+ T cells in BAL compared to blood. (C) Memory phenotype of CD8+CD161++TCRvα7.2+ T cells in BAL compared to blood. Data were analyzed using Wilcoxon matched-pairs signed rank test (n = 20). BAL, bronchoalveolar lavage; PBMC, peripheral blood mononuclear cells.
Figure 2
Figure 2
Characterization of CD8+CD161++TCRvα7.2+ T cells in airway lumen and peripheral circulation. BAL cells and PBMCs from HIV-uninfected adults were stained with fluorochrome-conjugated antibodies against surface markers of interest. (A) Representative flow cytometry plots showing CD103 expression in CD8+ T cells in matched BAL and PBMC samples from two healthy HIV-uninfected adults. (B) Proportion of CD103 expressing CD8+CD161++TCRvα7.2+ T cells in BAL and PBMCs. (C) CD103 expression intensity in CD8+CD161++TCRvα7.2+ T cells compared to classical CD8+ T cells from the airway lumen. Data were analyzed using Wilcoxon matched-pairs signed rank test (n = 19). BAL, bronchoalveolar lavage; PBMC, peripheral blood mononuclear cells.
Figure 3
Figure 3
Functional profile of CD8+CD161++TCRvα7.2+ T cells in airway lumen and peripheral circulation. BAL cells and PBMCs from HIV-uninfected adults were stimulated with PMA/Ionomycin for 6 h and responses were measured by intracellular cytokine staining for TNF, IFN-γ, and IL-17A. The response was obtained by gating on singlets, lymphocytes, viable (LIVE/DEAD Aqua), CD3+ cells, CD8+ cells/ CD8+CD161++ TCRvα7.2+ T cells and combination of three cytokines. (A) Each pie chart (top) represents the mean distribution across subjects of mono-functional, bi-functional and poly-functional cytokine producing cells (color coded as shown) within the total response in a particular CD161++TCRvα7.2+ T cell population. Bar charts (bottom) represent the mean and standard error of the mean (SEM) of the contribution of the indicated subset (x-axis) toward the total response against the indicated CD161++TCRvα7.2+ T cell subsets (color coded as shown). Permutation test was performed among the pie charts and Wilcoxon test was done among the bar charts using SPICE software (*p < 0.05, **p < 0.01). (B) Frequency of IL17A-producing cells in the CD103+ or CD103 CD8+ T cell/CD8+CD161++TCRvα7.2+ T cell populations subtracting background responses obtained from the non-stimulated controls. The horizontal bars represent median, interquartile range and highest/lowest value. Data were analyzed using Mann Whitney test (n = 11). BAL, bronchoalveolar lavage; IFN, interferon-gamma; TNF, tumor necrosis factor; IL17, interleukin-17A.
Figure 4
Figure 4
Depletion of airway CD103+CD8+CD161++TCRvα7.2+ T cells in untreated HIV-infected adults. BAL cells from HIV-uninfected and HIV-infected adults were stained with fluorochrome-conjugated antibodies against surface markers of interest. (A) Flow cytometry dot plots showing depletion of CD8+CD161++TCRvα7.2+ T cells. (B) Frequency of airway CD8+CD161++TCRvα7.2+ T cells in HIV-infected individuals compared to healthy controls (HIV, n = 39; HIV+, n = 41). (C) Frequency of CD103+/− airway CD8+CD161++TCRvα7.2+ T cells in HIV-infected individuals compared to healthy controls (HIV, n = 19; HIV+, n = 21). (D) Frequency of total CD8+ T cells and CD4+ T cells in HIV-infected individuals compared to healthy controls (HIV, n = 19; HIV+, n = 21). (E) Distribution of CD103+/− airway CD161++TCRvα7.2+ T cells in HIV-infected individuals compared to healthy controls (HIV, n = 19; HIV+, n = 21). (F) Association between frequency of airway CD103+ CD8+CD161++TCRvα7.2+ T cells and proportion of airway CD4+ T cells (n = 40; HIV n = 19, HIV+ n = 21). Data were analyzed using Mann Whitney test and the horizontal bars represent median, and interquartile range (B,C,D). Data were analyzed using Fisher's exact test (E). Data was analyzed using Pearson correlation test (F). BAL, bronchoalveolar lavage.
Figure 5
Figure 5
Depletion of airway CD8+CD161++TCRvα7.2+ T cells is inversely correlated with HIV plasma viral load. (A) Association between plasma viral load and frequency of airway CD8+CD161++TCRvα7.2+ T cells. Plasma viral load was log transformed (n = 25). (B) Association between peripheral blood CD4 count and frequency of airway CD8+CD161++TCRvα7.2+ T cells (n = 25). (C) Representative flow cytometry plots from an HIV-infected adult before and 1 year post ART initiation. (D) Frequency of airway CD8+CD161++TCRvα7.2+ T cells in from HIV-uninfected adults (before and 1 year post ART initiation) compared to healthy controls (HIV+ ART−/+, n = 6). Data was analyzed using Pearson correlation test (A,B). Data were analyzed using Wilcoxon matched-pairs signed rank test for paired comparisons (D). ART, anti-retroviral therapy.
Figure 6
Figure 6
Function profile of CD8+CD161++TCRvα7.2+ T cells in healthy HIV-uninfected individuals compared to HIV-infected adults. BAL cells were stimulated with PMA/Ionomycin for 6 h and responses were measured by intracellular cytokine staining for IL-17A, IFN-γ, and TNF. The phenotype of the responding cells was obtained by gating on singlets, lymphocytes, viable (LIVE/ DEAD Aqua), CD3+ cells, CD8+ cells, IL-17A+, and then a combination of CD161 and CD103. (A) CD103+ and (B) CD103. Each pie chart (top) represents the mean distribution across subjects of mono-functional, bi-functional and poly-functional cytokine producing cells (color coded as shown) within the total response in a particular CD8+CD161++TCRvα7.2+ T cell subset. Bar charts (bottom) represent the mean and standard error of the mean (SEM) of the contribution of the indicated subset (x-axis) toward the total response against the indicated CD8+CD161++TCRvα7.2+ T cell subsets (color coded as shown) (n = 11). Permutation test was performed among the pie charts and Wilcoxon test was done among the bar charts using SPICE software (*p < 0.05). BAL, bronchoalveolar; IFN, interferon-gamma; TNF, tumor necrosis factor; IL17, interleukin-17A.

References

    1. Martinson NA, Hoffmann CJ, Chaisson RE. Epidemiology of tuberculosis and HIV: recent advances in understanding and responses. Proc Am Thorac Soc. (2011) 8:288–93. 10.1513/pats.201010-064WR - DOI - PMC - PubMed
    1. Segal LN, Methe BA, Nolan A, Hoshino Y, Rom WN, Dawson R, et al. . HIV-1 and bacterial pneumonia in the era of antiretroviral therapy. Proc Am Thorac Soc. (2011) 8:282–7. 10.1513/pats.201006-044WR - DOI - PMC - PubMed
    1. Murray JF. Pulmonary complications of HIV-1 infection among adults living in Sub-Saharan Africa. Int J Tuberc Lung Dis. (2005) 9:826. - PubMed
    1. Benito N, Moreno A, Miro JM, Torres A. Pulmonary infections in HIV-infected patients: an update in the 21st century. Eur Respir J. (2012) 39:730–45. 10.1183/09031936.00200210 - DOI - PubMed
    1. Mwale A, Hummel A, Mvaya L, Kamng'ona R, Chimbayo E, Phiri J, et al. B cell, CD8 (+) T cell and gamma delta T cell lymphocytic alveolitis alters alveolar immune cell homeostasis in HIV-infected Malawian adults. Wellcome Open Res. (2017) 2:105 10.12688/wellcomeopenres.12869.1 - DOI - PMC - PubMed

Publication types