

Measuring crops in 3D: using geometry for plant phenotyping
- PMID: 31497064
- PMCID: PMC6719375
- DOI: 10.1186/s13007-019-0490-0
Measuring crops in 3D: using geometry for plant phenotyping
Abstract
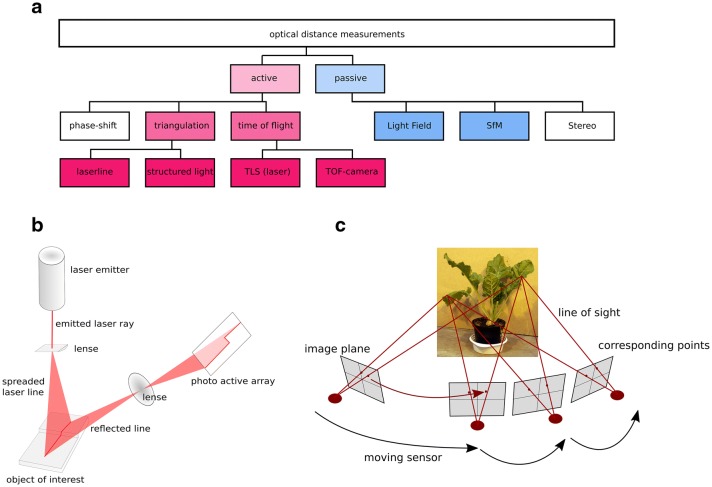
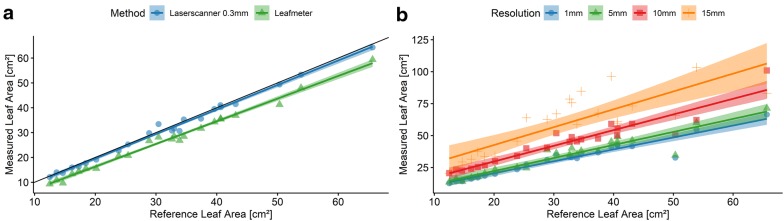
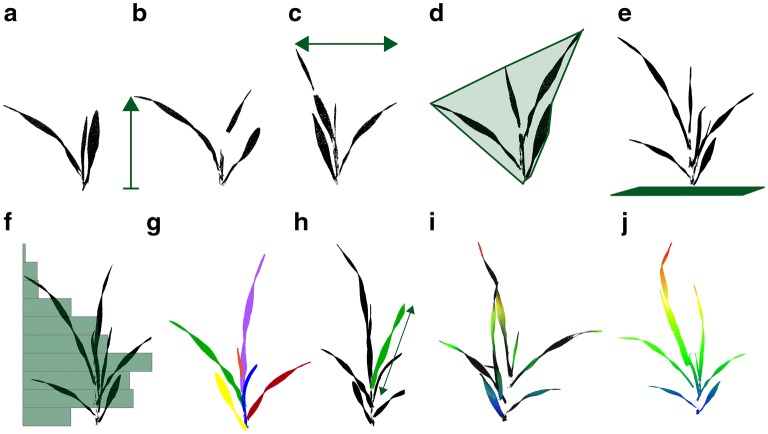
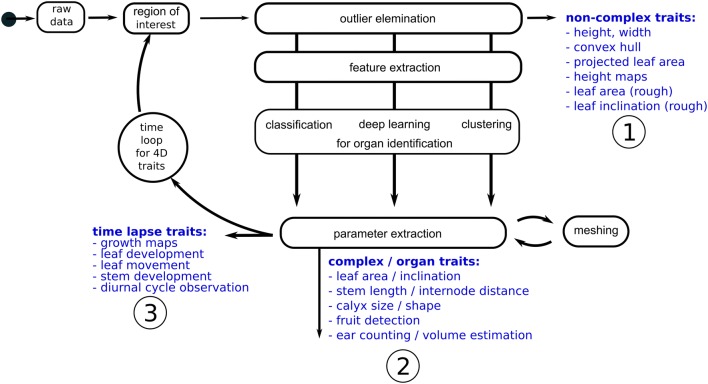
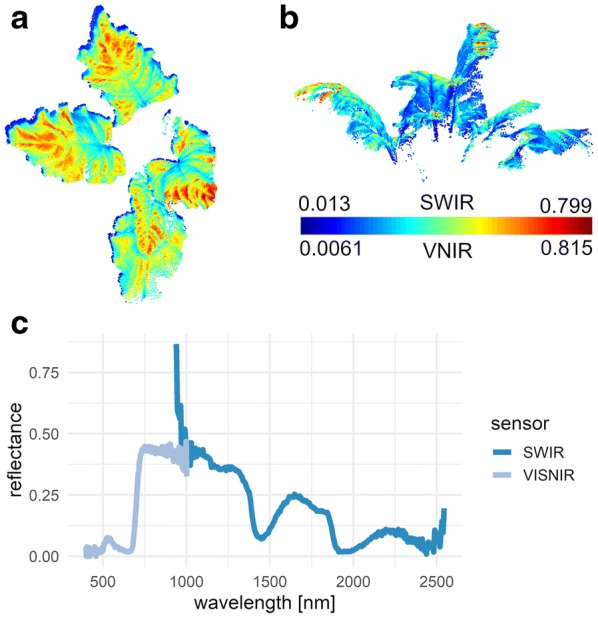
Using 3D sensing for plant phenotyping has risen within the last years. This review provides an overview on 3D traits for the demands of plant phenotyping considering different measuring techniques, derived traits and use-cases of biological applications. A comparison between a high resolution 3D measuring device and an established measuring tool, the leaf meter, is shown to categorize the possible measurement accuracy. Furthermore, different measuring techniques such as laser triangulation, structure from motion, time-of-flight, terrestrial laser scanning or structured light approaches enable the assessment of plant traits such as leaf width and length, plant size, volume and development on plant and organ level. The introduced traits were shown with respect to the measured plant types, the used measuring technique and the link to their biological use case. These were trait and growth analysis for measurements over time as well as more complex investigation on water budget, drought responses and QTL (quantitative trait loci) analysis. The used processing pipelines were generalized in a 3D point cloud processing workflow showing the single processing steps to derive plant parameters on plant level, on organ level using machine learning or over time using time series measurements. Finally the next step in plant sensing, the fusion of different sensor types namely 3D and spectral measurements is introduced by an example on sugar beet. This multi-dimensional plant model is the key to model the influence of geometry on radiometric measurements and to correct it. This publication depicts the state of the art for 3D measuring of plant traits as they were used in plant phenotyping regarding how the data is acquired, how this data is processed and what kind of traits is measured at the single plant, the miniplot, the experimental field and the open field scale. Future research will focus on highly resolved point clouds on the experimental and field scale as well as on the automated trait extraction of organ traits to track organ development at these scales.
Keywords: 3D plant scanning; Parameterization; Plant model; Plant traits; Point cloud.
Conflict of interest statement
Competing interestsThe author declares that he has no competing interests.
Figures
References
-
- Walklate PJ. A laserscanning instrument for geometry measuring crop. Science. 1989;46:275–284.
-
- Omasa K, Hosoi F, Konishi A. 3D lidar imaging for detecting and understanding plant responses and canopy structure. J Exp Bot. 2007;58(4):881–98. - PubMed
-
- Paulus S, Schumann H, Leon J, Kuhlmann H. A high precision laser scanning system for capturing 3D plant architecture and analysing growth of cereal plants. Biosyst Eng. 2014;121:1–11.
-
- Godin C. Representing and encoding plant architecture: a review. Ann For Sci. 2000;57(5):413–438.
Publication types
LinkOut - more resources
Full Text Sources
Other Literature Sources
