CD8+ cytotoxic and FoxP3+ regulatory T lymphocytes serve as prognostic factors in breast cancer
- PMID: 31497220
- PMCID: PMC6731430
CD8+ cytotoxic and FoxP3+ regulatory T lymphocytes serve as prognostic factors in breast cancer
Abstract
Background: There is conflicting evidence regarding the prognostic value of cytotoxic T cell infiltration in breast cancer. The aims of this study were to detect the expression levels and localization of FoxP3 and CD8 in invasive ductal carcinoma of the breast and to investigate the correlations among FoxP3+ regulatory T cells (Tregs), CD8+ cytotoxic T lymphocytes (CTLs), clinicopathological features, and prognosis in patients with breast cancer.
Methods: Immunohistochemistry was used to detect the expression levels and localization of FoxP3 and CD8. One-sample t-test, one-way analysis of variance, and Kaplan-Meier log-rank tests were used to analyze correlations between the expression levels of CD8 and FoxP3; Kaplan-Meier Log-rank test was used to analyze clinicopathological features to explore the prognostic significance of CD8 and FoxP3 in patients with breast cancer.
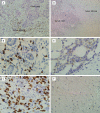
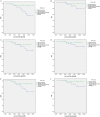
Results: FoxP3 expression in the tumor bed was higher than that in the stroma, while CD8 was primarily expressed in the stroma. CD8 expression was associated with favorable prognostic factors. However, FoxP3 expression and an increased ratio of total FoxP3+ Tregs to CD8+ CTLs were significantly correlated with unfavorable prognostic factors. Additionally, an increased ratio was associated with molecular subtypes (ER+Her2+, ER+Her2-, ER-Her2+, and ER-Her2-) of breast cancer. Overexpression of FoxP3 and a high FoxP3+/CD8+ ratio were correlated with poor overall survival (OS) and disease-free survival (DFS). However, CD8 expression only affected OS in patients with breast cancer.
Conclusions: Tumor-infiltrating lymphocytes are localized variously depending on the subtype. CD8+ CTLs were associated with a good prognosis, while FoxP3+ Tregs were associated with adverse outcomes in patients with breast cancer. CD8+ CTLs and FoxP3+ Tregs are potential predictive prognostic factors for patients with breast cancer.
Keywords: CD8; FoxP3; breast cancer; tumor bed; tumor stroma.
Conflict of interest statement
None.
Figures


References
-
- Siegel R, Ma J, Zou Z, Jemal A. Cancer statistics, 2014. CA Cancer J Clin. 2014;64:9–29. - PubMed
-
- Yu P, Fu YX. Tumor-infiltrating T lymphocytes: friends or foes? Lab Invest. 2006;86:231–45. - PubMed
-
- Lopes JE, Torgerson TR, Schubert LA, Anover SD, Ocheltree EL, Ochs HD, Ziegler SF. Analysis of FOXP3 reveals multiple domains required for its function as a transcriptional repressor. J Immunol. 2006;177:3133–42. - PubMed
LinkOut - more resources
Full Text Sources
Research Materials
Miscellaneous
