. 2019 Aug 19:7:4300312.
doi: 10.1109/JTEHM.2019.2935721. eCollection 2019.

Elastographic Tomosynthesis From X-Ray Strain Imaging of Breast Cancer

Affiliations

Elastographic Tomosynthesis From X-Ray Strain Imaging of Breast Cancer

Corey Sutphin et al. IEEE J Transl Eng Health Med. .

Abstract

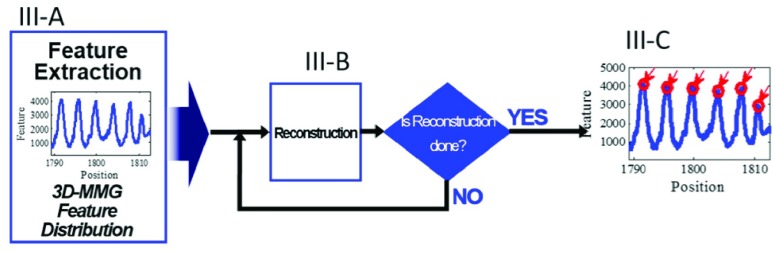
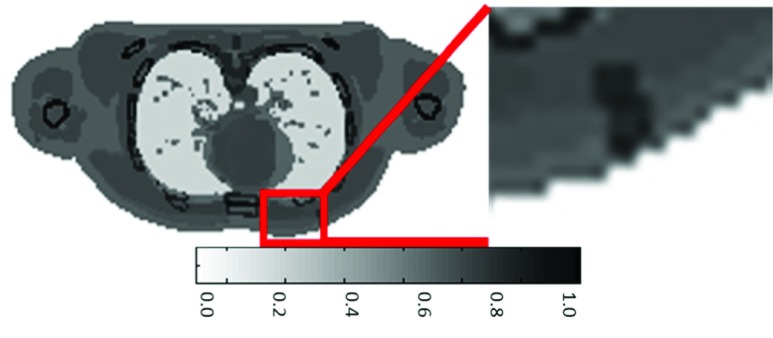
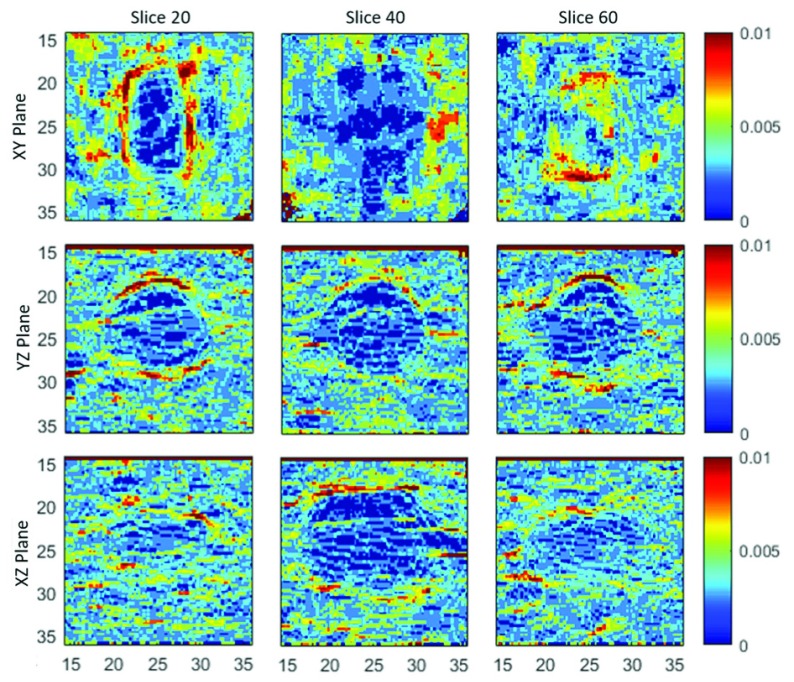
Noncancerous breast tissue and cancerous breast tissue have different elastic properties. In particular, cancerous breast tumors are stiff when compared to the noncancerous surrounding tissue. This difference in elasticity can be used as a means for detection through the method of elastographic tomosynthesis by means of physical modulation. This paper deals with a method to visualize elasticity of soft tissues, particularly breast tissues, via x-ray tomosynthesis. X-ray tomosynthesis is now used to visualize breast tissues with better resolution than the conventional single-shot mammography. The advantage of X-ray tomosynthesis over X-ray CT is that fewer projections are needed than CT to perform the reconstruction, thus radiation exposure and cost are both reduced. Two phantoms were used for the testing of this method, a physical phantom and an in silico phantom. The standard root mean square error in the tomosynthesis for the physical phantom was 2.093 and the error in the in silico phantom was negligible. The elastographs were created through the use of displacement and strain graphing. A Gaussian Mixture Model with an expectation-maximization clustering algorithm was applied in three dimensions with an error of 16.667%. The results of this paper have been substantial when using phantom data. There are no equivalent comparisons yet in 3D x-ray elastographic tomosynthesis. Tomosynthesis with and without physical modulation in the 3D elastograph can identify feature groupings used for biopsy. The studies have potential to be applied to human test data used as a guide for biopsy to improve accuracy of diagnosis results. Further research on this topic could prove to yield new techniques for human patient diagnosis purposes.

Keywords: 3D X-ray; Elastography; mammogram; strain; tomosynthesis.


Figures

FIGURE 1.
FIGURE 1.
X-ray elastography method using an ultrasonic wave to create the force on the region of interest. This diagram shows how an elastogram is captured for viewing.
FIGURE 2.
FIGURE 2.
Concept of Tomosynthesis:. The tube rotates around to capture slices in a circle at a desired angle. The elements shown above can be seen in (2) and (3). Image receptors and X-ray Tube can vary in size and number.
FIGURE 3.
FIGURE 3.
Overall processes of the proposed method and relationship among III-A, III-B, and III-C.
FIGURE 4.
FIGURE 4.
Images of the XCAT Phantom generated with the spherical tumor placed in the left breast. The tumor has a diameter of 10mm. (a) Shows the sagittal view while (b) shows the transverse view. The tumor is in red color.
FIGURE 5.
FIGURE 5.
Flowchart of simple ART procedure. All variables shown are for all voxels in a RoI and can be calculated fully using Eqs. (3), (4), (5) and (6). The iterations will cease when formula image is below some user defined variable UDT, as shown in Eq. (7).
FIGURE 6.
FIGURE 6.
The general appearance of lesions. The images represent the different elasticity scores from 1–5 with increasing chances of malignancy.
FIGURE 7.
FIGURE 7.
(a) Shows a diagram of the dimensions of the coronal view of the phantom and shows the method by which the phantom was compressed . (b) Shows a slice of the coronal view of the physical phantom through the use of Computational Tomography.
FIGURE 8.
FIGURE 8.
The difference in breathing through pixel level subtraction. The difference in the tumors is boxed in red and is zoomed in.
FIGURE 9.
FIGURE 9.
The 3D Tomosynthesis of both the physical phantom and the phantom in silico. The top row shows the middle slice of 3D physical phantom, where (a) is the transverse view, (b) is the coronal view, and (c) is the sagittal view. The bottom row shows the middle slice of 3D phantom in silico, where (d) is the transverse view, (e) is the coronal view, and (f) is the sagittal view.
FIGURE 10.
FIGURE 10.
Reconstruction error for the physical phantom. (a) shows the Average RMSE per slice when the phantom is reconstructed using 30 projections. (b) shows the overall average RMSE of all slices when the number of projections used is varied.
FIGURE 11.
FIGURE 11.
A vector map of the displacement in both the physical phantom as compression is applied and the in silico phantom as breathing occurs. (a) the vector map is placed over a slice of the coronal view of the uncompressed phantom. (b) the vector map is placed on the exhaled phantom.
FIGURE 12.
FIGURE 12.
The displacement vector map in three dimensions for the physical phantom. This data is similar to the data in Fig. 11 (a) with an added dimension. Referring to the standard directions of orientation as used in Eqs. (8), (11) and (12), the coronal axis corresponds to the formula image direction, the sagittal axis corresponds to the formula image direction, and the transverse axis corresponds to the formula image direction.
FIGURE 13.
FIGURE 13.
Absolute Strain Value Images in the xy plane (top), yz plane (middle), and xz (bottom) of the physical phantom from displacement in the i, j, and k direction. All images are of the middle most slice of the physical phantom.
FIGURE 14.
FIGURE 14.
Absolute Strain Value Images in the xy plane (top), yz plane (middle), and xz (bottom) of the physical phantom from displacement in the k direction. The first column is slice z (top) = x (middle) = y (bottom) = 20. The second column is slice z (top) = x (middle) = y (bottom) = 40. The third column is slice z (top) = x (middle) = y (bottom) = 60.
FIGURE 15.
FIGURE 15.
The displacement vector map in 3D for the in silico phantom.
FIGURE 16.
FIGURE 16.
A pixel subtraction of the physical phantom and in silico phantom after tomosynthesis of the uncompressed and compressed data sets of the physical phantom. The view shown is the coronal view (a) and transverse view (b). The RoI is boxed in red.
FIGURE 17.
FIGURE 17.
The 2D phantom Elastography that was used in the feature clustering. This particular plot is the absolute strain in the z direction as viewed from the coronal plane. The elasticity feature extracted in red with the SNN clustering algorithm applied.
FIGURE 18.
FIGURE 18.
The Gaussian mixture model with EM technique when applied to the data in Fig. 17. The maximum allowed groups of data was 5, but only three were found. The cancer can be seen as the red cluster.
FIGURE 19.
FIGURE 19.
The Gaussian mixture model with EM technique when applied to the data in Fig. 18. The maximum allowed groups of data was 5, but only three were found. The cancer can be seen as the red cluster. This shows the same clustering, but overlaid onto the Elastograph.
FIGURE 20.
FIGURE 20.
The clustering of the elastic property in three dimensions with a max of 5 group regions.
FIGURE 21.
FIGURE 21.
The clustering of the elastic property in three dimensions with a max of 5 group regions.
FIGURE 22.
FIGURE 22.
The log likelihood at each iteration in the variable of group k. k ranges from 2-10.
FIGURE 23.
FIGURE 23.
All cluster regions overlaid on top of each other.
FIGURE 24.
FIGURE 24.
The groupings of 3D clustering features in the physical phantom extracted of 6 region. The cancer insert is identified in the large cylindrical cluster #3.

Similar articles

Cited by

References

    1. Wells P. N. T. and Liang H.-D., “Medical ultrasound: Imaging of soft tissue strain and elasticity,” J. Roy. Soc. Interface, vol. 64, no. 8, pp. 1521–1549, 2011. - PMC - PubMed
    1. Bercoff J., Tanter M., and Fink M., “Supersonic shear imaging: A new technique for soft tissue elasticity mapping,” IEEE Trans. Ultrason., Ferroelectr., Freq. Control, vol. 51, no. 4, pp. 396–409, Apr. 2004. - PubMed
    1. Zhao H.et al., “External vibration multi-directional ultrasound shearwave elastography (EVMUSE): Application in liver fibrosis staging,” IEEE Trans. Med. Imag., vol. 33, no. 11, pp. 2140–2148, Nov. 2014. - PMC - PubMed
    1. Bouchard R. R., Dahl J. J., Hsu S. J., Palmeri M. L., and Trahey G. E., “Image quality, tissue heating, and frame rate trade-offs in acoustic radiation force impulse imaging,” IEEE Trans. Ultrason., Ferroelectr., Freq. Control, vol. 56, no. 1, pp. 63–76, Jan. 2009. - PMC - PubMed
    1. Egorov V. and Sarvazyan A. P., “Mechanical imaging of the breast,” IEEE Trans. Med. Imag., vol. 27, no. 9, pp. 1275–1287, Sep. 2008. - PMC - PubMed