. 2019 Sep;9(9):346.
doi: 10.1007/s13205-019-1875-5. Epub 2019 Aug 26.

A comprehensive analysis of the B3 superfamily identifies tissue-specific and stress-responsive genes in chickpea (Cicer arietinum L.)

Affiliations

A comprehensive analysis of the B3 superfamily identifies tissue-specific and stress-responsive genes in chickpea (Cicer arietinum L.)

Subodh Verma et al. 3 Biotech. 2019 Sep.

Abstract

The aim of this study was to provide a comprehensive analysis of the plant-specific B3 domain-containing transcription factors (TFs) in chickpea. Scanning of the chickpea genome resulted in the identification of 51 B3 domain-containing TFs that were located on seven out of eight chickpea chromosomes. Based on the presence of additional domains other than the B3 domain, the candidates were classified into four subfamilies, i.e., ARF (24), REM (19), LAV (6) and RAV (2). Phylogenetic analysis classified them into four groups in which members of the same group had similar intron-exon organization and motif composition. Genome duplication analysis of the candidate B3 genes revealed an event of segmental duplication that was instrumental in the expansion of the B3 gene family. Ka/Ks analysis showed that the B3 gene family was under purifying selection. Further, chickpea B3 genes showed maximum orthology with Medicago followed by soybean and Arabidopsis. Promoter analyses of the B3 genes led to the identification of several tissue-specific and stress-responsive cis-regulatory elements. Expression profiling of the candidate B3 genes using publicly available RNA-seq data of several chickpea tissues indicated their putative role in plant development and abiotic stress response. These findings were further validated by real-time expression analysis. Overall, this study provides a comprehensive analysis of the B3 domain-containing proteins in chickpea that would aid in devising strategies for crop manipulation in chickpea.

Keywords: B3 domain-containing protein; Chickpea; Expression analysis; Phylogeny.


Conflict of interest statement

Conflict of interestOn behalf of all authors, the corresponding author states that there is no conflict of interest.

Figures

Fig. 1
Fig. 1
Chromosomal distribution of CarB3 members on eight chickpea chromosomes. Genes under colored blocks are tandemly duplicated genes and genes with symbols are segmentally duplicated genes (Online Resource 4)
Fig. 2
Fig. 2
a Phylogenetic classification of CarB3 members. The CarB3 members were divided into four groups based on their clustering pattern. b Exon–intron organization of the CarB3 genes. Exons and introns are represented by blue boxes and grey lines, respectively
Fig. 3
Fig. 3
A combined NJ-based phylogenetic tree based on B3 sequences of chickpea, Medicago and Arabidopsis
Fig. 4
Fig. 4
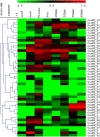
Hierarchical clustering of CarB3 genes based on digital expression analysis in different chickpea tissues. Scale bar represents the log2 normalized RPKM values. Color gradient denotes level of expression; red being high and green being low
Fig. 5
Fig. 5
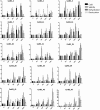
Expression analysis of nine selected CarB3 genes in different chickpea tissues through qRT-PCR. Values on Y-axis denote relative expression values. DAA, days after anthesis. Error bars indicate standard deviation (± SD) of three biological replicates each calculated from three technical replicates. Asterisks indicate statistically significant difference between control (leaf) and other tissues (t test, *P < 0.05, **P < 0.01)
Fig. 6
Fig. 6
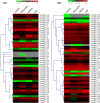
Heat map showing the digital expression of CarB3 genes in different stress conditions: desiccation, salinity, cold. a Control and stressed root tissues. b Control and stressed shoot tissues. Clustering method: hierarchical clustering. Color gradient denotes level of expression; red being high and green being low. Grey color depicts no expression
Fig. 7
Fig. 7
Expression analysis of 15 selected CarB3 genes in response to different stress conditions: cold, salinity, dehydration, desiccation at different time points through qRT-PCR. Values on Y-axis denote relative expression values. Error bars indicate standard deviation (± SD) of three biological replicates each calculated from three technical replicates. Asterisks indicate statically significant difference from the control (t test, *P < 0.05, **P < 0.01)

Similar articles

Cited by

References

    1. Agarwal G, et al. Genome-wide dissection of AP2/ERF and HSP90 gene families in five legumes and expression profiles in chickpea and pigeonpea. Plant Biotechnol J. 2016;14:1563–1577. doi: 10.1111/pbi.12520. - DOI - PMC - PubMed
    1. Bailey TL, et al. MEME SUITE: tools for motif discovery and searching. Nucleic Acids Res. 2009;37:W202–W208. doi: 10.1093/nar/gkp335. - DOI - PMC - PubMed
    1. Bailey TL, Johnson J, Grant CE, Noble WS. The MEME suite. Nucleic Acids Res. 2015;43:W39–W49. doi: 10.1093/nar/gkv416. - DOI - PMC - PubMed
    1. Bhattacharjee A, Ghangal R, Garg R, Jain M. Genome-wide analysis of homeobox gene family in legumes: identification, gene duplication and expression profiling. PLoS One. 2015 doi: 10.1371/journal.pone.0119198. - DOI - PMC - PubMed
    1. Bulyk ML. Computational prediction of transcription-factor binding site locations. Genome Biol. 2004;5:201. doi: 10.1186/gb-2003-5-1-201. - DOI - PMC - PubMed

LinkOut - more resources