. 2019 Jul 23:14:285-299.
doi: 10.1016/j.omtm.2019.06.011. eCollection 2019 Sep 13.

Temporary Reduction of Membrane CD4 with the Antioxidant MnTBAP Is Sufficient to Prevent Immune Responses Induced by Gene Transfer

Affiliations

Temporary Reduction of Membrane CD4 with the Antioxidant MnTBAP Is Sufficient to Prevent Immune Responses Induced by Gene Transfer

Sylvie Da Rocha et al. Mol Ther Methods Clin Dev. .

Abstract

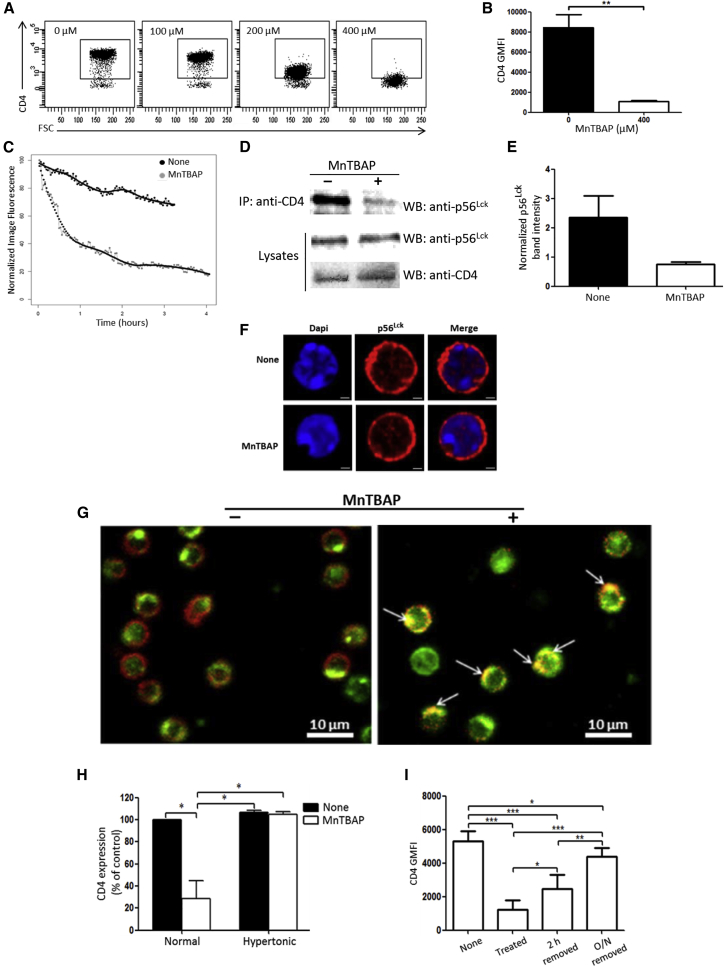
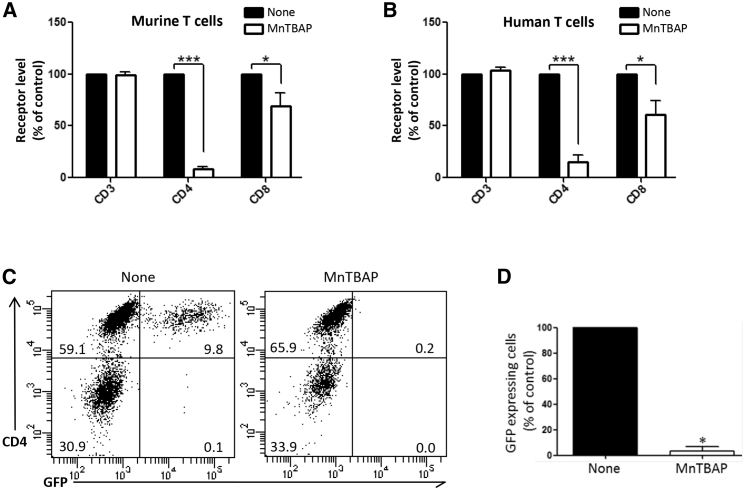
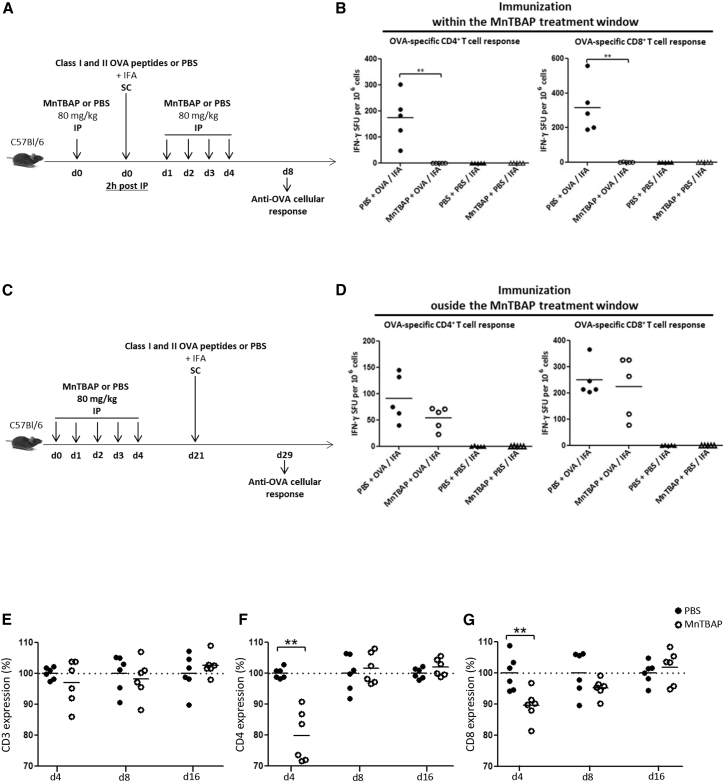
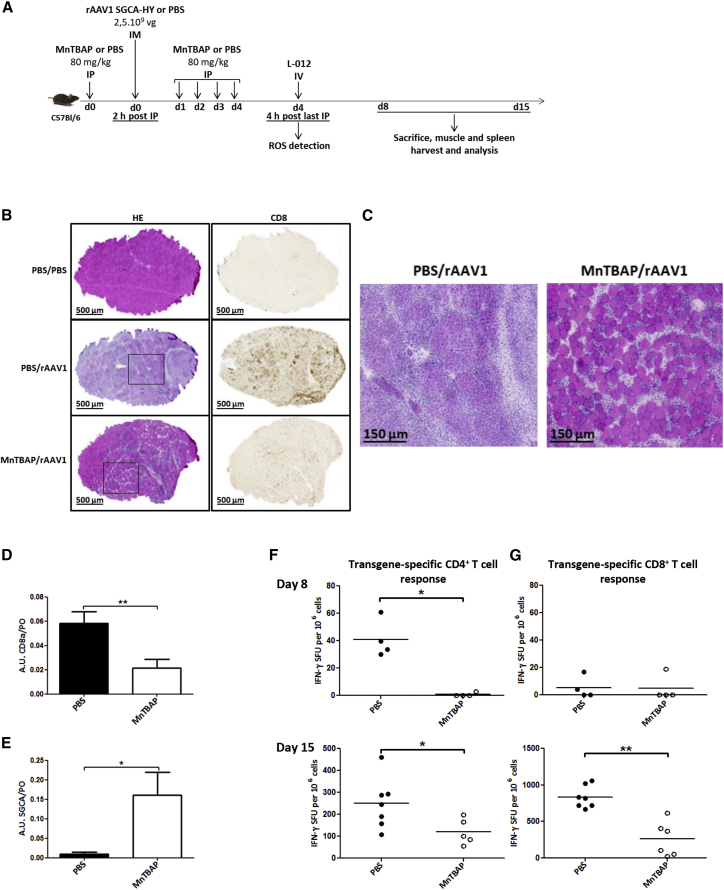
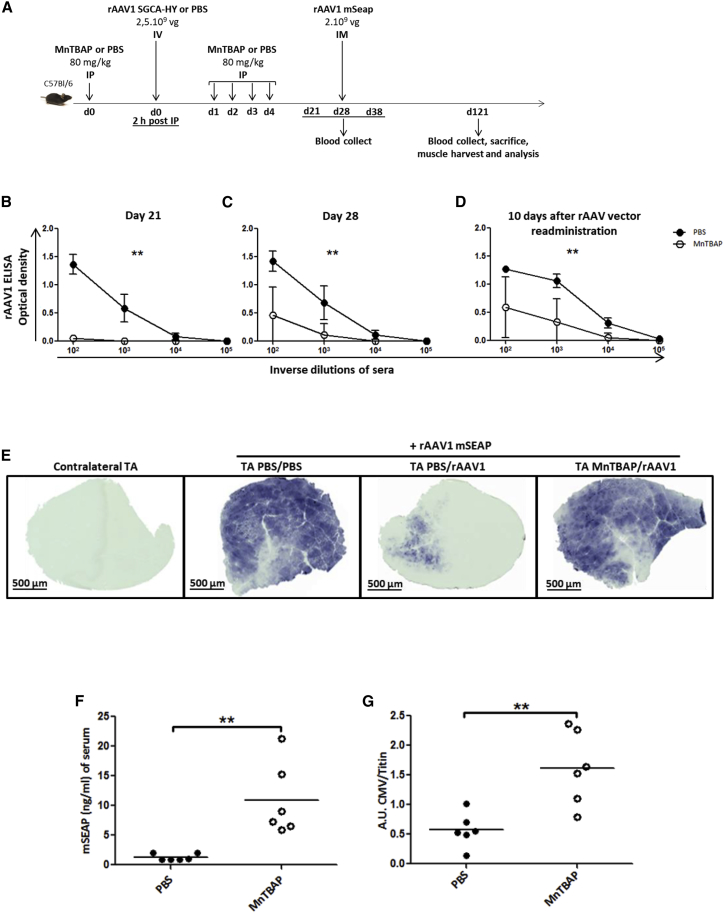
Unexpectedly, the synthetic antioxidant MnTBAP was found to cause a rapid and reversible downregulation of CD4 on T cells in vitro and in vivo. This effect resulted from the internalization of membrane CD4 T cell molecules into clathrin-coated pits and involved disruption of the CD4/p56Lck complex. The CD4 deprivation induced by MnTBAP had functional consequences on CD4-dependent infectious processes or immunological responses as shown in various models, including gene therapy. In cultured human T cells, MnTBAP-induced downregulation of CD4 functionally suppressed gp120- mediated lentiviral transduction in a model relevant for HIV infection. The injection of MnTBAP in mice reduced membrane CD4 on lymphocytes in vivo within 5 days of treatment, preventing OVA peptide T cell immunization while allowing subsequent immunization once treatment was stopped. In a mouse gene therapy model, MnTBAP treatment at the time of adenovirus-associated virus (AAV) vector administration, successfully controlled the induction of anti-transgene and anti-capsid immune responses mediated by CD4+ T cells, enabling the redosing mice with the same vector. These functional data provide new avenues to develop alternative therapeutic immunomodulatory strategies based on temporary regulation of CD4. These could be particularly useful for AAV gene therapy in which novel strategies for redosing are needed.

Keywords: Immunomodulation; MnTBAP; antigen reexposure; gene transfer; gp120; membrane CD4 internalization; neutralizing antibodies; p56lck; rAAV capsid; redosing.


Figures

Figure 1
Figure 1
MnTBAP-Induced CD4 Reversible Internalization Mechanism (A) CD4+ T cells isolated by negative selection from C57BL/6 mouse splenic cell suspensions were cultured for 2 h in complete medium with increasing doses of MnTBAP (0 to 400 μM), and then analyzed by flow cytometry for CD4 expression on live splenic T cells. Data are representative of two independent experiments. (B) Graph indicating CD4 GMFI (geometric mean fluorescence intensity) on splenic CD4+ T cells after treatment for 2 h with or without MnTBAP at 400 μM. (n = 4 independent experiments). (C) Time-lapse analysis of CD4 cell surface over time decline on CD4+ T cells. After CFSE and CD4 staining, splenic CD4+ T cells were incubated in the absence or presence of MnTBAP and subjected to live-cell time-lapse image acquisition every 120 s for 4 h. CD4 fluorescence intensities, normalized to the maximum fluorescence measured at t0, are reported for each condition. One representative experiment out of two is indicated. (D) MnTBAP induces disruption of the CD4/p56Lck complex. Protein extracts were prepared from splenic CD4+ T cells after treatment for 2 h with or without MnTBAP. Crude extracts were subjected to CD4 immunoprecipitation (IP), followed by western blotting and immunodetection analysis with anti-p56Lck. The p56Lck and CD4 expression levels were also analyzed in whole-cell lysates (Lysates) as controls for the quantities of the proteins of interest before immunoprecipitation. Lysates either in the absence or in the presence of MnTBAP presented approximately equal amounts of p56Lck and CD4. Images are representative of two independent experiments. (E) Graph of p56Lck band intensities detected on CD4 immunoprecipitated materials and normalized with the corresponding band in the lysates. Data are representative of two independent experiments. (F) Confocal microscopy analysis of p56Lck distribution in splenic CD4+ T cells after treatment for 2 h with or without MnTBAP. The red fluorescence (Alexa Fluor 594) signal localizes p56Lck (middle panels), while the blue fluorescence (DAPI) counterstains the nuclei (left panels). Merged images of p56Lck and DAPI-stained nuclei are shown in the right panels. Scale bars, 1 μm. (G) CD4 internalization by a clathrin-mediated endocytosis. Murine splenic CD4+ T cells were cultured for 2 h with or without MnTBAP and then were collected and subjected to immunostaining with anti-CD4 (red signal) and anti-clathrin (green signal) antibodies. Arrows indicate colocalization of CD4 and clathrin resulting in yellow spots. Scale bars, 10 μm. (H) Evidence for clathrin-mediated endocytosis of CD4 molecules. Murine splenic CD4+ T cells were cultured for 2 h with or without MnTBAP in either complete medium (Normal) or hypertonic sucrose medium (Hypertonic) to inhibit specifically clathrine-dependent endocytosis. Cells were then collected and subjected to CD4 cell-surface expression analysis by flow cytometry. Results are expressed as CD4 expression relative to control (complete medium without MnTBAP; Normal), which is defined as 100%. (I) MnTBAP-induced CD4 internalization is reversible. Murine splenic CD4+ T cells were cultured for 2 h with or without MnTBAP. Cells were then stained with Fixable Viability Dye-eFluor 780 (None), stained with anti-CD4-Pacific Blue and fixed (Treated), or washed to remove MnTBAP and put back in culture for either an additional 2 h (2 h removed) or overnight (O/N removed) and finally stained as described earlier and fixed. Fixed cells in all conditions were analyzed by flow cytometry for their CD4 expression, reported on the graph as CD4 GMFI. Cells in the cultures without MnTBAP (None, control) are set at 100% (n = 3 independent experiments). Statistical analyses in (B), (H), and (I) were performed using the Mann-Whitney test. *p < 0.05; **p < 0.005; ***p < 0.0001.
Figure 2
Figure 2
MnTBAP Induces Dramatic Loss of CD4 on the Surface of Murine and Human T Lymphocytes and Inhibits Transduction of Human T Lymphocytes by Lentiviral Vectors Pseudotyped with gp120HXB2-env (A and B) MnTBAP effect on murine (A) and human (B) T lymphocyte receptor level. Murine splenic (A) and human peripheral blood (B) cells were treated for 2 h with or without MnTBAP and then analyzed by flow cytometry for cell-surface CD3, CD4, and CD8 expression on live cells. The results of geometric means of fluorescence for each receptor are expressed relative to the corresponding values of the control non-treated cells (None, arbitrarily set at 100%); n = 3–4 independent experiments. For each receptor, statistical comparisons between untreated and treated cells were made using the Mann-Whitney test. (C) CD3+ T cells from human peripheral blood were transduced in the absence or presence of 400 μM MnTBAP on retronectin-coated plates, with gp120HXB2-env pseudotyped lentiviral vectors expressing GFP reporter gene. Transduction efficiency was assessed by flow cytometry via GFP expression 72 h post-transduction. Representative CD4/GFP dot plots are shown, with inset numbers indicating the percentage of cells in each quadrant. (D) Normalized percentages of GFP+ cells obtained 72 h post-transduction. The percentage of GFP+ cells in the cultures without MnTBAP (None, control) is set at 100% (n = 4 independent experiments). Statistical analysis in (D) was performed using paired t test. *p < 0.05; ***p < 0.0001.
Figure 3
Figure 3
Temporary In Vivo Inhibition of the Immune System by MnTBAP (A) Schema of OVA peptide immunization within the MnTBAP treatment window. C57BL/6 mice received i.p. multi-injections of MnTBAP or an equivalent volume of PBS (80 mg/kg daily during 5 days, day 0 to day 4). Two hours after the first i.p. injection of MnTBAP or PBS, mice received s.c. immunizations of 100 μg each of class I and class II OVA peptides or PBS emulsified with IFA. Splenic cells were harvested 8 days after immunization (day 8) to measure CD4+ and CD8+ T cell responses by IFN-γ ELISPOT, following in vitro stimulation with OVA323–339 and OVA257–264 peptides, respectively. (B) OVA-specific CD4+ (left panel) and CD8+ (right panel) T cell responses. MnTBAP (open symbols) or PBS (closed symbols) i.p. injections and OVA peptide (circles) or PBS (triangles) s.c. immunizations. Each symbol represents IFN-γ spot-forming units (duplicate measures) in each mouse. Horizontal bars indicate the average values. (C) Schema of OVA peptide immunization outside the MnTBAP treatment window. Immunizations were as described earlier, with one difference: that mice received s.c. injections of OVA peptides or PBS, emulsified with IFA, 21 days after the first i.p. injection of MnTBAP or PBS. Splenic cells were harvested 8 days after immunization (day 29) to measure CD4+ and CD8+ T cell responses by IFN-γ ELISPOT, following in vitro stimulation with OVA323–339 and OVA257–264 peptides, respectively. (D) OVA-specific CD4+ (left panel) and CD8+ (right panel) T cell responses. MnTBAP (open symbols) or PBS (closed symbols) i.p. injections and OVA peptide (circles) or PBS (triangles) s.c. immunizations. Each symbol represents IFN-γ spot-forming units (duplicate measures) of each mouse. Horizontal bars indicate the average values. Data represent one experiment with five mice per group. (E–G) MnTBAP effect on cell-surface levels of CD3 (E), CD4 (F), and CD8 (G) cell populations in the spleen. C57BL/6 mice received i.p. multi-injections with MnTBAP or with an equivalent volume of PBS (day 0 to day 4). At days 4, 8, and 16, spleens were harvested and analyzed for cell-surface CD3, CD4, and CD8 expression by flow cytometry. Geometric means of fluorescence for each receptor are expressed relative to the cells from the control PBS-treated mice (PBS, arbitrarily set at 100%). Results are from 2 independent experiments. All statistical analyses were performed using the Mann-Whitney test. **p < 0.005.
Figure 4
Figure 4
MnTBAP Counteracts the Adverse Effects of rAAV-Mediated i.m. Gene Delivery (A) Protocol outline. C57BL/6 mice received i.p. multi-injections of MnTBAP or an equivalent volume of PBS (80 mg/kg daily during 5 days). Two hours after the first injection of MnTBAP, mice were administered PBS or rAAV1_CMV_SGCA_HY vector (2.5 × 109 vg per mouse) in the left TA. Four days post-vector injection, mice were intravenously injected with 1.5 mg L-012, a chemical agent that reacts with ROS to produce light. Fifteen days post-rAAV-vector injection, muscle integrity, transgene and CD8a mRNA expression, and transgene-specific T cell responses were analyzed. (B) Histological analysis of injected TA muscle from PBS- or MnTBAP-treated mice, 15 days following injection of rAAV vector or control PBS. Microscopy analysis of cryosections of rAAV-injected muscles after H&E staining (left panel) or anti-CD8 staining followed by enzymatic detection (right panel) was performed. Images are representative of one experiment out of 2, with 3–4 mice per group. Scale bars, 500 μm. (C) High magnifications of selected areas shown in (D). Scale bars, 150 μm. (D and E) Analysis of CD8a and SGCA transgene expression by RT-PCR in injected TA muscle 15 days following injection of rAAV vector or control PBS. Levels of CD8a (D) and SGCA (E) mRNA are expressed in arbitrary units (AU) relative to the endogenous murine acidic ribosomal phosphoprotein (PO) mRNA (n = 2; 3–4 mice per group). (F and G) Analysis of transgene-specific T cell responses: 8 days (upper panels) and 15 days (lower panels) post-injection of vector, splenic cells were harvested to measure the frequency of transgene specific CD4+ (F) and CD8+ (G) T cells by IFN-γ ELISPOT. Dots represent individual mice. Horizontal bars indicate the average values. All statistical analyses were performed using the Mann-Whitney test. *p < 0.05; **p < 0.005.
Figure 5
Figure 5
MnTBAP Inhibits Primary and Memory Humoral Response against Capsid Allowing Efficient Readministration of rAAV Vector in Muscle (A) Protocol outline. C57BL/6 mice received i.p. multi-injections of MnTBAP (80 mg/kg daily during 5 days) or an equivalent volume of PBS. Two hours after the first injection of MnTBAP, mice were administered i.v. injections with PBS or rAAV1_CMV_SGCA_HY vector (2.5 × 109 vg per mouse). Each mouse was subjected to a second injection of rAAV serotype 1 encoding the mSEAP reporter gene (2 × 109 vg of rAAV1_CMV_mSEAP vector per mouse) into the left TA, 28 days after the first injection of vector. (B and C) Analysis of capsid-specific primary humoral response: anti- rAAV1 IgG titers were measured by ELISA in serum samples harvested at day 21 (B) and day 28 (C) post-vector injection. Curves represent the mean ± SD of optical density (OD) obtained at the indicated dilutions of sera from 6 mice per group and compare anti-rAAV IgG response in MnTBAP-treated mice (open circles) with that in PBS-treated mice (closed circles). (D) Analysis of capsid-specific memory humoral response after rAAV1 readministration (rAAV1_CMV_mSEAP vector) in TA. Measurement of anti- rAAV1 IgG titers by ELISA was performed in serum samples from 6 mice per group, harvested 10 days after rAAV vector readministration. For (B)–(D), statistical analyses with the Mann-Whitney test were performed on AUC values, obtained from ODs at four dilution points for each mouse serum. (E) Histochemical detection of mSEAP in injected TA harvested 93 days after vector readministration (day 121). In the first panel, non-injected right contralateral TA is represented as negative control. The second panel shows injected left TA with the rAAV1_CMV_mSEAP vector alone as positive control of mSEAP expression in muscle. The third and fourth panels show administered left TA with the rAAV1_CMV_mSEAP vector in PBS- or MnTBAP-treated mice, respectively, and who received an initial systemic injection of rAAV1_CMV_SGCA_HY vector. Images are representative of one mouse out of 6 per group. Scale bars, 500 μm. (F) Serum level of mSEAP measured by a chemiluminescent assay from mice harvested 93 days after vector readministration (day 121). Dots represent individual mice (closed and open circles show PBS- and MnTBAP-treated mice, respectively). Statistical analyses were performed using the Mann-Whitney test. (G) Copy number analysis of readministered rAAV1 in injected TA by quantitative CMV PCR assay with endogeneous titin gene for normalization. Data are expressed in AUs relative to titin DNA. Each symbol represents a mouse (closed and open circles indicate PBS- and MnTBAP-treated mice, respectively). Statistical analyses were performed using the Mann-Whitney test. **p < 0.005.

Similar articles

Cited by

References

    1. Patel M., Day B.J. Metalloporphyrin class of therapeutic catalytic antioxidants. Trends Pharmacol. Sci. 1999;20:359–364. - PubMed
    1. Amarnath S., Dong L., Li J., Wu Y., Chen W. Endogenous TGF-beta activation by reactive oxygen species is key to Foxp3 induction in TCR-stimulated and HIV-1-infected human CD4+CD25- T cells. Retrovirology. 2007;4:57. - PMC - PubMed
    1. Liu D., Shan Y., Valluru L., Bao F. Mn (III) tetrakis (4-benzoic acid) porphyrin scavenges reactive species, reduces oxidative stress, and improves functional recovery after experimental spinal cord injury in rats: comparison with methylprednisolone. BMC Neurosci. 2013;14:23. - PMC - PubMed
    1. Suresh M.V., Yu B., Lakshminrusimha S., Machado-Aranda D., Talarico N., Zeng L., Davidson B.A., Pennathur S., Raghavendran K. The protective role of MnTBAP in oxidant-mediated injury and inflammation in a rat model of lung contusion. Surgery. 2013;154:980–990. - PMC - PubMed
    1. Cui Y.Y., Qian J.M., Yao A.H., Ma Z.Y., Qian X.F., Zha X.M., Zhao Y., Ding Q., Zhao J., Wang S., Wu J. SOD mimetic improves the function, growth, and survival of small-size liver grafts after transplantation in rats. Transplantation. 2012;94:687–694. - PMC - PubMed