

Early-Life Predictors of Systolic Blood Pressure Trajectories From Infancy to Adolescence: Findings From Project Viva
- PMID: 31497850
- PMCID: PMC6825838
- DOI: 10.1093/aje/kwz181
Early-Life Predictors of Systolic Blood Pressure Trajectories From Infancy to Adolescence: Findings From Project Viva
Abstract
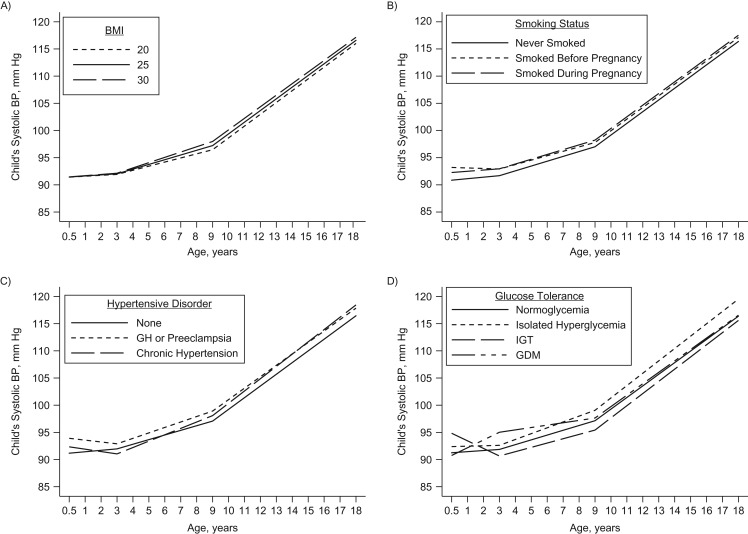
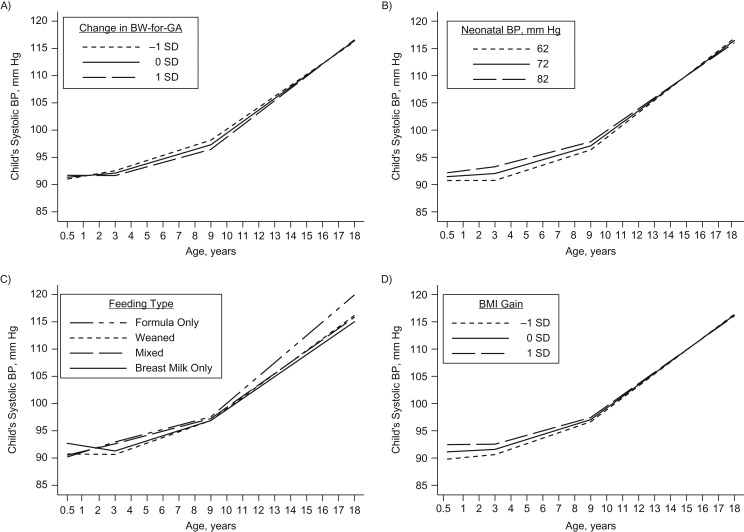
Childhood blood pressure (BP) is a strong predictor of later risk of cardiovascular disease. However, few studies have assessed dynamic BP trajectories throughout the early-life period. We investigated the relationship between early-life factors and systolic BP (SBP) from infancy to adolescence using linear spline mixed-effects models among 1,370 children from Project Viva, a Boston, Massachusetts-area cohort recruited in 1999-2002. After adjusting for confounders and child height, we observed higher SBP in children exposed to gestational diabetes mellitus (vs. normoglycemia; age 3 years: β = 3.16 mm Hg (95% confidence interval (CI): 0.28, 6.04); age 6 years: β = 1.83 mm Hg (95% CI: 0.06, 3.60)), hypertensive disorders of pregnancy (vs. normal maternal BP; age 6 years: β = 1.39 mm Hg (95% CI: 0.10, 2.67); age 9 years: β = 1.84 mm Hg (95% CI: 0.34, 3.34); age 12 years: β = 1.70 mm Hg (95% CI: 0.48, 2.92)), higher neonatal SBP (per 10-mm Hg increase; age 3 years: β = 1.26 mm Hg (95% CI: 0.42, 2.09); age 6 years: β = 1.00 mm Hg (95% CI: 0.49, 1.51); age 9 years: β = 0.75 mm Hg (95% CI: 0.17, 1.33)), and formula milk in the first 6 months of life (vs. breast milk only; age 12 years: β = 2.10 mm Hg (95% CI: 0.46, 3.74); age 15 years: β = 3.52 mm Hg (95% CI: 1.40, 5.64); age 18 years: β = 4.94 mm Hg (95% CI: 1.88, 7.99)). Our findings provide evidence of programming of offspring SBP trajectories by gestational diabetes, hypertensive disorders of pregnancy, and formula milk intake and of neonatal BP being a potentially useful marker of childhood BP. These factors could be relevant in identifying children who are at risk of developing elevated BP.
Keywords: blood pressure; blood pressure trajectory; developmental programming; pregnancy; risk factors; systolic blood pressure.
© The Author(s) 2019. Published by Oxford University Press on behalf of the Johns Hopkins Bloomberg School of Public Health. All rights reserved. For permissions, please e-mail: journals.permissions@oup.com.
Figures
References
-
- Gillman MW, Rich-Edwards JW, Rifas-Shiman SL, et al. Maternal age and other predictors of newborn blood pressure. J Pediatr. 2004;144(2):240–245. - PubMed
-
- Gademan MG, van Eijsden M, Roseboom TJ, et al. Maternal prepregnancy body mass index and their children’s blood pressure and resting cardiac autonomic balance at age 5–6 years. Hypertension. 2013;62(3):641–647. - PubMed
