. 2020 Jan;177(2):239-253.
doi: 10.1111/bph.14859. Epub 2019 Nov 12.

Delayed intervention with a novel SGLT2 inhibitor NGI001 suppresses diet-induced metabolic dysfunction and non-alcoholic fatty liver disease in mice

Affiliations

Delayed intervention with a novel SGLT2 inhibitor NGI001 suppresses diet-induced metabolic dysfunction and non-alcoholic fatty liver disease in mice

Hao Chiang et al. Br J Pharmacol. 2020 Jan.

Abstract

Background and purpose: Non-alcoholic fatty liver disease (NAFLD), including non-alcoholic steatohepatitis, is closely related to metabolic diseases such as obesity and diabetes. Despite an accumulating number of studies, no pharmacotherapy that targets NAFLD has received general approval for clinical use.

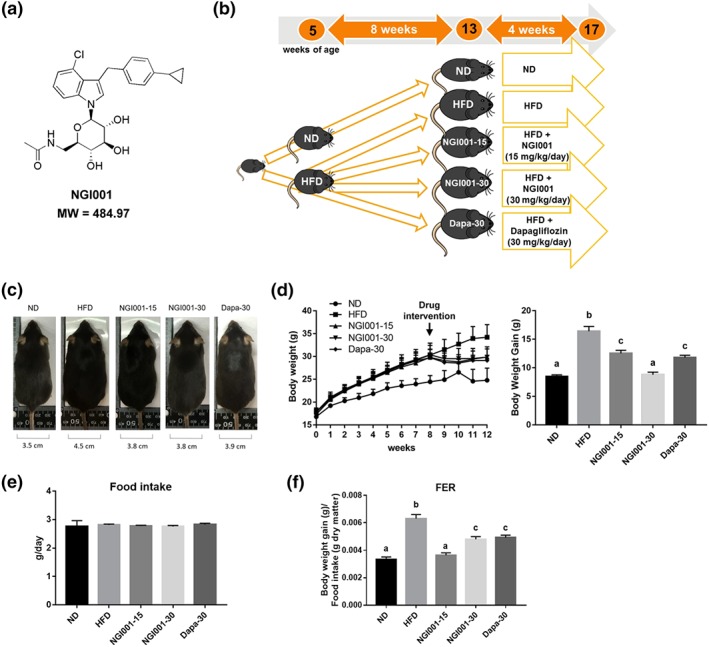
Experimental approach: Inhibition of the sodium-glucose cotransporter 2 (SGLT2) is a promising approach to treat diabetes, obesity, and associated metabolic disorders. In this study, we investigated the effect of a novel SGLT2 inhibitor, NGI001, on NAFLD and obesity-associated metabolic symptoms in high-fat diet (HFD)-induced obese mice.

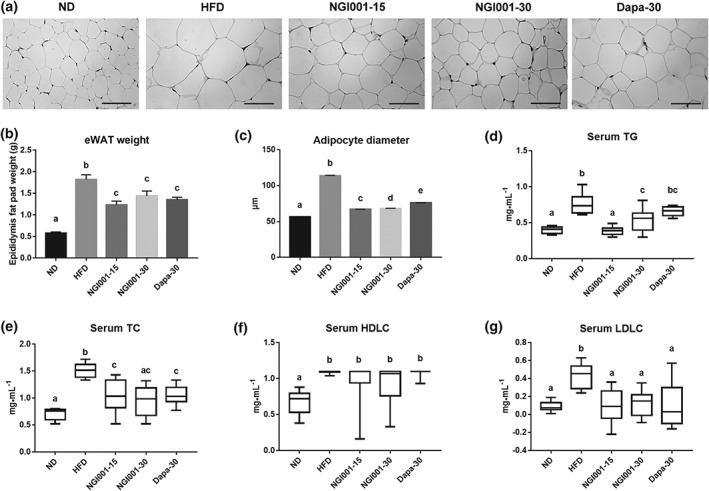
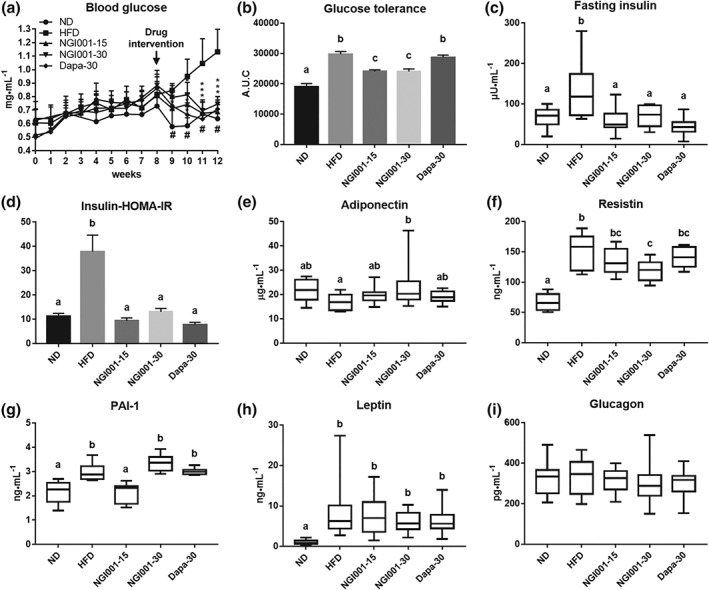
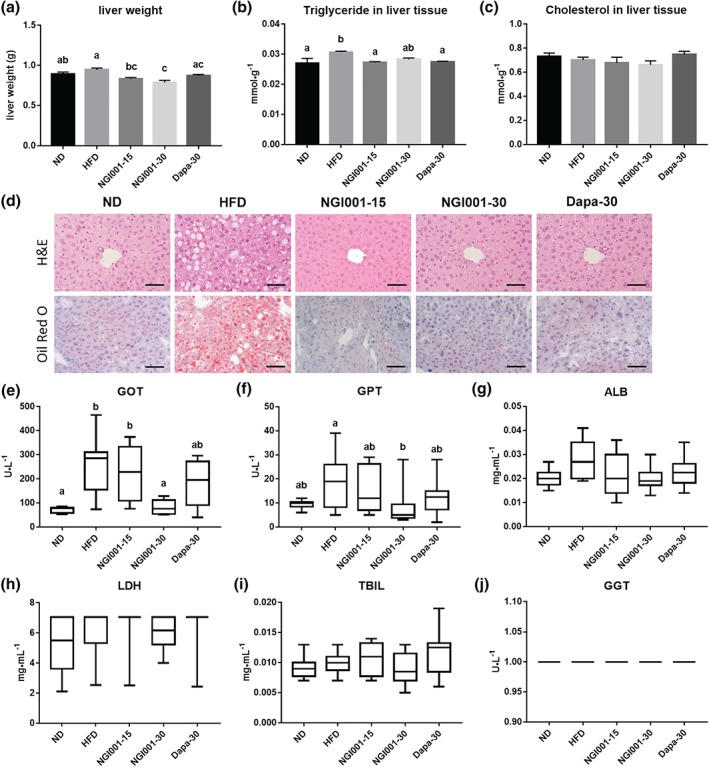
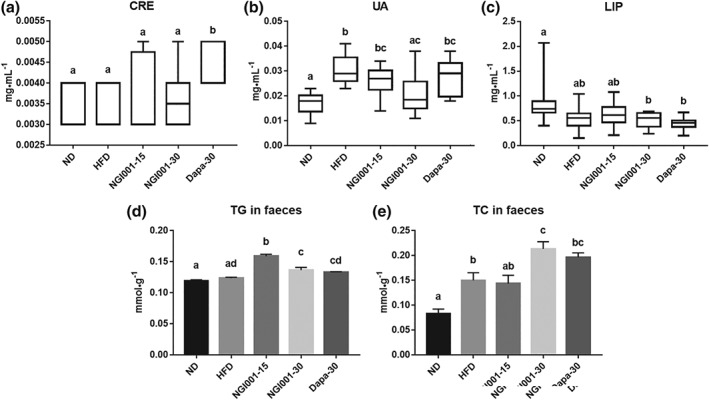
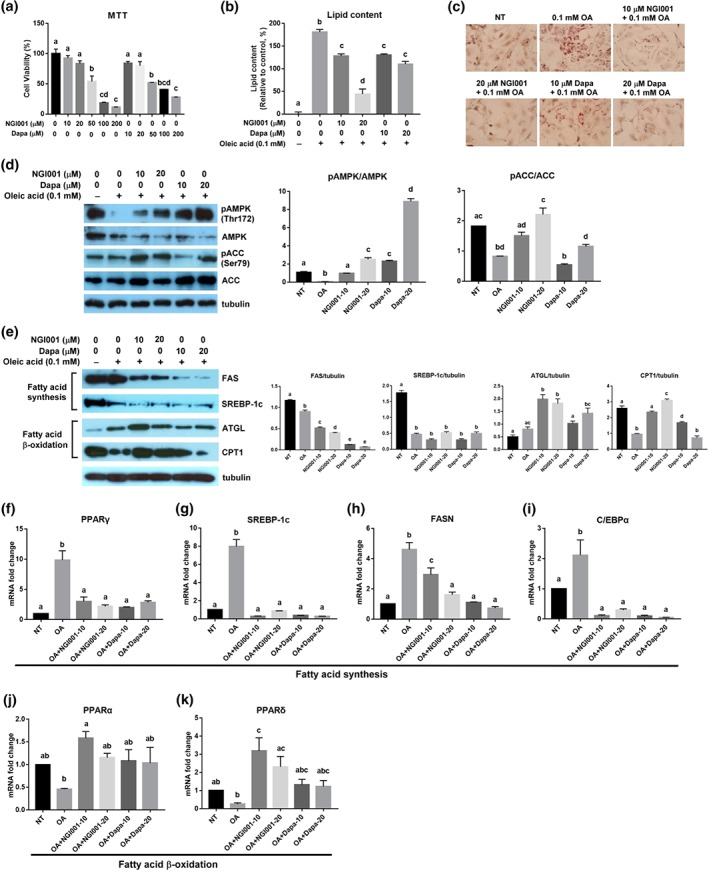
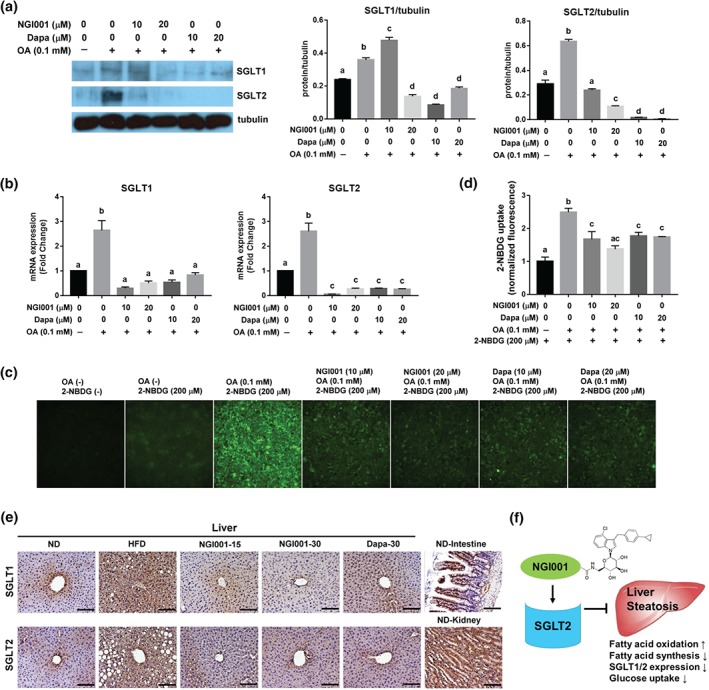
Key results: Delayed intervention with NGI001 protected against body weight gain, hyperglycaemia, hyperlipidaemia, and hyperinsulinaemia, compared with HFD alone. Adipocyte hypertrophy was prevented by administering NGI001. NGI001 inhibited impaired glucose metabolism and regulated the secretion of adipokines associated with insulin resistance. In addition, NGI001 supplementation suppressed hepatic lipid accumulation and inflammation but had little effect on kidney function. In-depth investigations showed that NGI001 ameliorated fat deposition and increased AMPK phosphorylation, resulting in phosphorylation of its major downstream target, acetyl-CoA carboxylase, in human hepatocyte HuS-E/2 cells. This cascade ultimately led to the down-regulation of downstream fatty acid synthesis-related molecules and the up-regulation of downstream β oxidation-associated molecules. Surprisingly, NGI001 decreased gene and protein expression of SGLT1 and SGLT2 and glucose uptake in oleic acid-treated HuS-E/2 cells.

Conclusion and implications: Our findings suggest the novel SGLT2 inhibitor, NGI001 has therapeutic potential to attenuate or delay the onset of diet-induced metabolic diseases and NAFLD.


Conflict of interest statement

The authors declare no conflicts of interest.

Figures

Figure 1
Figure 1
The experimental approach using NGI001 and the effect of NGI001 on morphology, body weight gain, food intake, and food efficiency ratio in HFD‐induced obese mice. (a) The structure of NGI001. (b) The experimental approach. The 5‐week‐old C57BL/6 male mice were fed a normal diet (ND) or high‐fat diet (HFD) for 8 weeks. After that, the ND group continued receiving an ND, and the HFD group either continued on that diet or were administered NGI001 (15 or 30 mg·kg−1·day−1) or dapagliflozin (Dapa; 30 mg·kg−1·day−1), in addition, by oral gavage for a further 4 weeks. At 17 weeks of age, the mice were killed, and the follow‐up analysis was conducted. (c) Changes in body shape and the waistline. (d) Body weight gain during the study. (e) Food intake. (f) Food efficiency ratio (FER). Data are shown as means ± SEM (n = 12 per group). In the graphs, bars labelled with different letters (a, b, c) indicate significant (P < .05) differences between them; bars with the same letter indicate no significant (P > .05) difference; one‐way ANOVA with Tukey's post hoc tests
Figure 2
Figure 2
The effect of NGI001 on fat deposition and serum lipid levels in HFD‐induced obese mice. (a) H&E staining of adipocytes in the epididymal white adipose tissue (eWAT). (b) The weight of eWAT. (c) The adipocyte diameters. The level of serum (d) TG, (e) TC, (f) HDLC, and (g) LDL cholesterol (LDLC). The scale bar is 100 μM. Data are shown as means ± SEM (n = 10 per group) or as box plots of raw data showing median, inter quartile range, and whiskers identifying minimum and maximum values. In the graphs, bars labelled with different letters (a, b, c) indicate significant (P < .05) differences between them; bars with the same letter indicate no significant (P > .05) difference; one‐way ANOVA with Tukey's post hoc tests. In the case where two letters are present above the bars, each letter should be compared separately with the letters of the other bars to determine whether the results show statistically significant differences
Figure 3
Figure 3
The effect of NGI001 on glucose metabolism and insulin resistance in HFD‐induced obese mice. (a) Fasting blood glucose levels after 4 weeks of drug intervention. (b) AUC of intraperitoneal glucose tolerance test. (c) Serum insulin levels after 16 hr of fasting. (d) The homeostasis model assessment of insulin resistance (HOMA‐IR) index calculated using fasting blood glucose and insulin levels. The levels of insulin resistance related adipokines (e) adiponectin, (f) resistin, (g) PAI‐1, and (h) leptin. The level of the insulin related hormone glucagon from the pancreas (i). Data are shown as means ± SEM (n = 10 per group) or as box plots of raw data showing median, inter quartile range, and whiskers identifying minimum and maximum values. * P < .05, HFD versus drug. # P<.05, HFD versus ND. In the graphs, bars labelled with different letters (a, b, c) indicate significant (P < .05) differences between them; bars with the same letter indicate no significant (P > .05) difference; one‐way ANOVA with Tukey's post hoc tests. Where two letters are present above the bars, each letter should be compared separately with the letters of the other bars to determine whether the results show statistically significant differences
Figure 4
Figure 4
The effect of NGI001 on fat deposition and inflammation in the livers of HFD‐induced obese mice. (a) Liver weight. (b) Hepatic triglyceride level. (c) Hepatic cholesterol level. (d) H&E staining and Oil Red O staining of transverse liver sections (original magnification of 200×). Serum levels of the hepatic inflammation markers (e) glutamic oxaloacetic transaminase (GOT) and (f) glutamic pyruvic transaminase (GPT). The serum levels of the liver biochemical markers (g) albumin (ALB), (h) LDH, (i) total bilirubin (TBIL), and (j) γ‐glutamyltransferase (GGT). The scale bar is 100 μM. Data are shown as means ± SEM (n = 10 per group) or as box plots of raw data showing median, inter quartile range, and whiskers identifying minimum and maximum values. or as box plots of raw data showing median, inter quartile range, and whiskers identifying minimum and maximum values. In the graphs, bars labelled with different letters (a, b, c) indicate significant (P < .05) differences between them; bars with the same letter indicate no significant (P > .05) difference; one‐way ANOVA with Tukey's post hoc tests. Where two letters are present above the bars, each letter should be compared separately with the letters of the other bars to determine whether the results show statistically significant differences
Figure 5
Figure 5
The effect of NGI001 on renal and pancreatic function and excretion of triglyceride and cholesterol in the feces of HFD‐induced obese mice. The serum levels of the kidney function markers (a) creatinine (CRE) and (b) uric acid (UA). The serum levels of the pancreatic inflammation marker (c) lipase (LIP). The levels of (d) triglyceride and (e) cholesterol in the feces. Data are shown as box plots of raw data showing median, inter quartile range, and whiskers identifying minimum and maximum values or means ± SEM (n = 12 per group). In the graphs, bars labelled with different letters (a, b, c) indicate significant (P < .05) differences between them; bars with the same letter indicate no significant (P > .05) difference; one‐way ANOVA with Tukey's post hoc tests. Where two letters are present above the bars, each letter should be compared separately with the letters of the other bars to determine whether the results show statistically significant differences
Figure 6
Figure 6
The effect of NGI001 on OA‐induced lipid accumulation, lipogenesis, and fatty acid β oxidation in HuS‐E/2 cells. (a) Cell viability following treatment with NGI001. HuS‐E/2 cells were incubated with the indicated concentration of NGI001 for 24 hr; then cell viability was determined using the MTT assay and expressed as a percentage of the value for untreated cells. (b, c) HuS‐E/2 cells were incubated for 18 hr with the indicated concentrations of OA, NGI001, or dapagliflozin; then quantitative analysis of lipid deposition in the Oil Red O‐stained cells was performed, shown in panel (b), and micrographs of the Oil Red O staining were captured using a microscope at 200× original magnification, shown in panel (c). (d, e) HuS‐E/2 cells were incubated for 18 hr with the indicated concentrations of OA, NGI001, or dapagliflozin and then analysed by western blotting for phosphorylation of AMPK at Thr172 and ACC at Ser79, total AMPK, and ACC in panel (d). Protein expression of total FAS, SREBP‐1c, ATGL, CPT1, and tubulin was analysed in panel (e). Tubulin served as a loading control. Quantitative analysis with Multi Gauge V3.0 is shown. NT represents cells without OA or drug treatment. (f–k) HuS‐E/2 cells were incubated in medium containing 0.1 mM of oleic acid (OA) with NGI001 at 10 μM (NGI001–10) and 20 μM (NGI001–20) and dapagliflozin at 10 μM (Dapa‐10) and 20 μM (Dapa‐20) for 18 hr. The levels of fatty acid synthesis‐related genes (f) PPARγ, (g) SREBP‐1c, (h) FASN, and (i) CCAAT/enhancer‐binding protein α (C/EBPα). The levels of fatty acid β oxidation‐related genes (j) PPARα and (k) PPARδ. Experiments were performed in triplicate, and data are presented as mean ± SEM (n = 6 per group). In the graphs, bars labelled with different letters (a, b, c) indicate significant (P < .05) differences between them; bars with the same letter indicate no significant (P > .05) difference; one‐way ANOVA with Tukey's post hoc tests. Where two letters are present above the bars, each letter should be compared separately with the letters of the other bars to determine whether the results show statistically significant differences
Figure 7
Figure 7
The effect of NGI001 on the expression of SGLT1 and SGLT2 and glucose uptake. (a) Protein expression of SGLT1 and SGLT2 in HuS‐E2 cells. HuS‐E/2 cells were incubated for 18 hr with the indicated concentrations of OA, NGI001, or dapagliflozin and then analysed by western blotting for SGLT1 and SGLT2. Tubulin served as a loading control. Quantitative analysis with Multi Gauge V3.0 is shown in the right panel. (b) Gene expression of SGLT1 and SGLT2 in HuS‐E2 cells. HuS‐E/2 cells were incubated for 18 hr with the indicated concentrations of OA, NGI001, or dapagliflozin; then RNA was isolated and subjected to real‐time PCR analysis to detect SGLT1 and SGLT2 mRNA. (c) Amounts of 2‐NBDG uptake in HuS‐E/2 cells. HuS‐E/2 cells were incubated in Na+ buffer for 10 min with 200 μM of 2‐NBDG. The fluorescent images were taken at 200× magnification. (d) Quantification of 2‐NBDG fluorescence intensity. The 2‐NBDG values were normalized to the fluorescence intensity. Experiments were performed in triplicate, and data are presented as mean ± SEM (n = 6 per group). In the graphs, bars labelled with different letters (a, b, c) indicate significant (P < .05) differences between them; bars with the same letter indicate no significant (P > .05) difference; one‐way ANOVA with Tukey's post hoc tests. Where two letters are present above the bars, each letter should be compared separately with the letters of the other bars to determine whether the results show statistically significant differences. (e) The effect of NGI001 on SGLT1 and SGLT2 expression in the livers of HFD‐induced obese mice. IHC detection of SGLT1 or SGLT2 in the liver tissue and that of SGLT1 and SGLT2 in the kidney and intestine served as positive controls. The scale bar is 100 μM. (f) A diagram of the pharmacological mechanisms of NGI001 action

Similar articles

Cited by

References

    1. Alexander, S. P. H. , Cidlowski, J. A. , Kelly, E. , Marrion, N. V. , Peters, J. A. , Faccenda, E. , … CGTP Collaborators (2017). The Concise Guide to PHARMACOLOGY 2017/18: Nuclear hormone receptors. British Journal of Pharmacology, 174, S208–S224. 10.1111/bph.13880 - DOI - PMC - PubMed
    1. Alexander, S. P. H. , Fabbro, D. , Kelly, E. , Marrion, N. V. , Peters, J. A. , Faccenda, E. , … CGTP Collaborators (2017). The Concise Guide to PHARMACOLOGY 2017/18: Enzymes. British Journal of Pharmacology, 174, S272–S359. 10.1111/bph.13877 - DOI - PMC - PubMed
    1. Alexander, S. P. , Kelly, E. , Marrion, N. V. , Peters, J. A. , Faccenda, E. , Harding, S. D. , … CGTP Collaborators (2017). The Concise Guide to PHARMACOLOGY 2017/18: Transporters. British Journal of Pharmacology, 174(Suppl 1), S360–S446. 10.1111/bph.13883 - DOI - PMC - PubMed
    1. Alexander, S. P. H. , Roberts, R. E. , Broughton, B. R. S. , Sobey, C. G. , George, C. H. , Stanford, S. C. , … Ahluwalia, A. (2018). Goals and practicalities of immunoblotting and immunohistochemistry: A guide for submission to the British Journal of Pharmacology. British Journal of Pharmacology, 175, 407–411. 10.1111/bph.14112 - DOI - PMC - PubMed
    1. Aly, H. H. , Watashi, K. , Hijikata, M. , Kaneko, H. , Takada, Y. , Egawa, H. , … Shimotohno, K. (2007). Serum‐derived hepatitis C virus infectivity in interferon regulatory factor‐7‐suppressed human primary hepatocytes. Journal of Hepatology, 46, 26–36. 10.1016/j.jhep.2006.08.018 - DOI - PubMed

Publication types

MeSH terms