. 2019 Oct 1;129(10):4377-4392.
doi: 10.1172/JCI127718.

Ex vivo screen identifies CDK12 as a metastatic vulnerability in osteosarcoma

Affiliations

Ex vivo screen identifies CDK12 as a metastatic vulnerability in osteosarcoma

Ian Bayles et al. J Clin Invest. .

Abstract

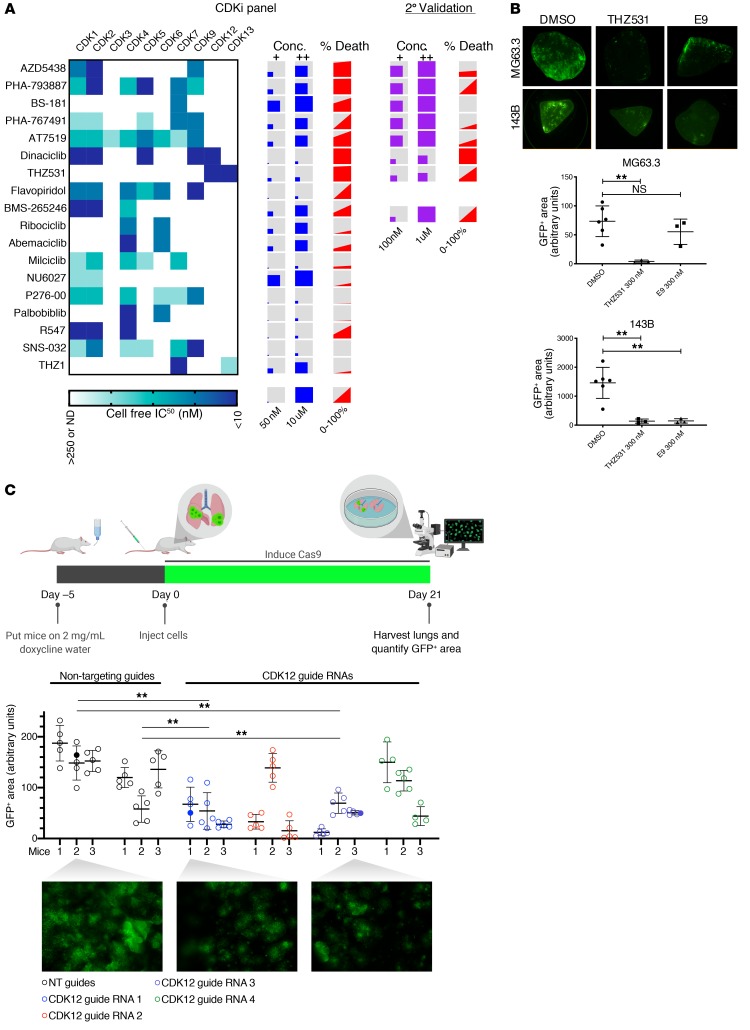
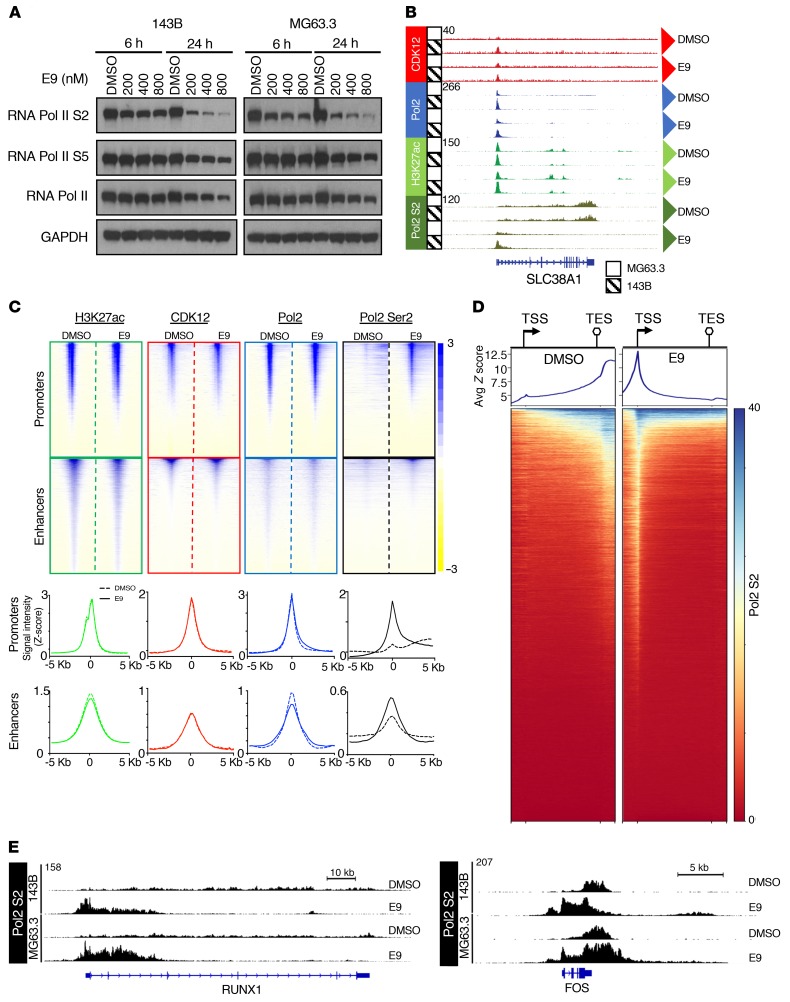
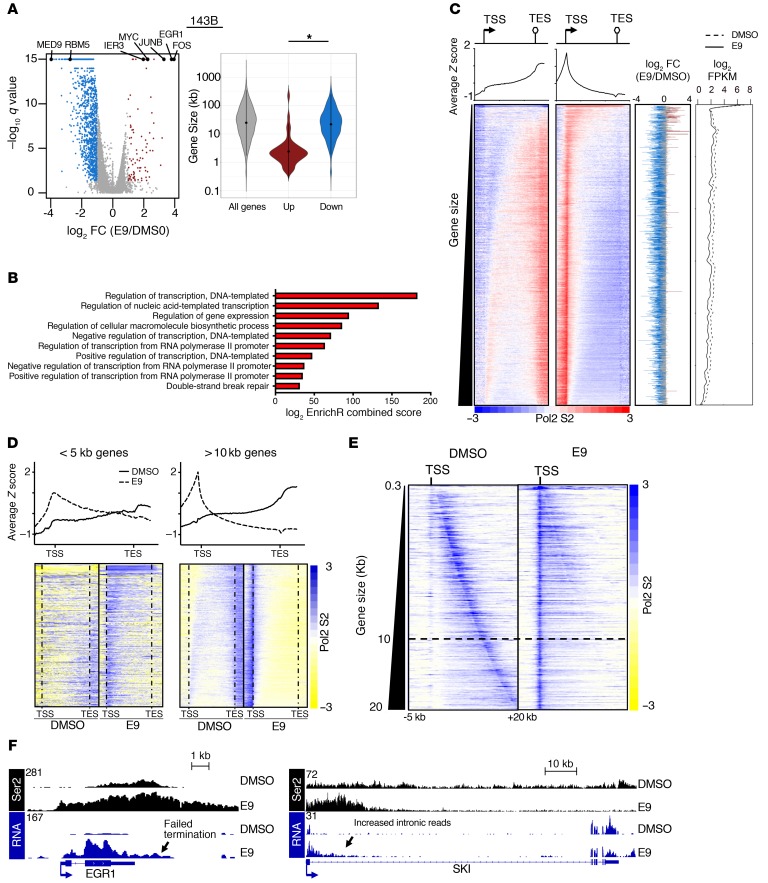
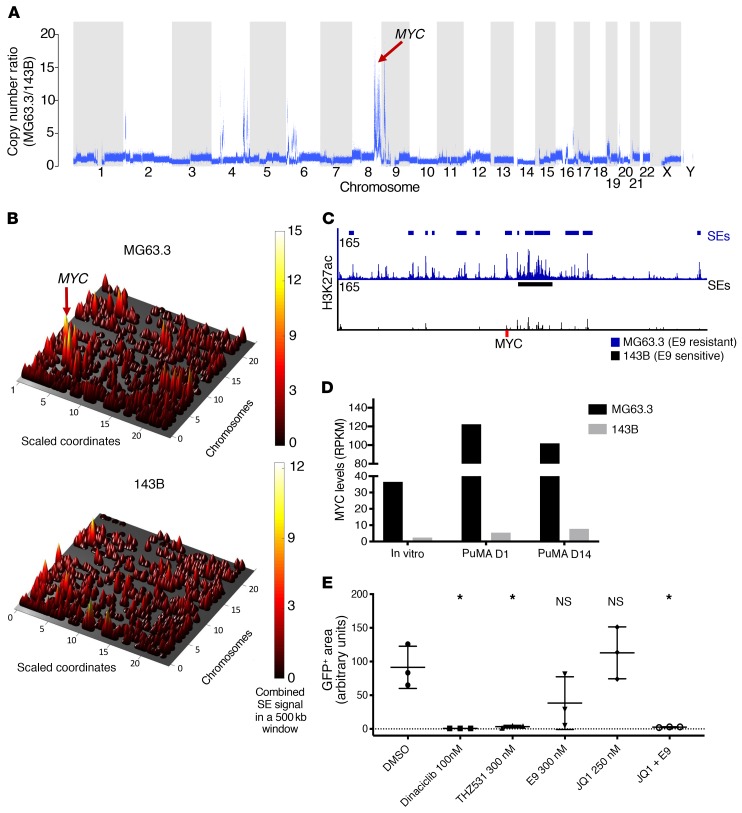
Despite progress in intensification of therapy, outcomes for patients with metastatic osteosarcoma (OS) have not improved in thirty years. We developed a system that enabled preclinical screening of compounds against metastatic OS cells in the context of the native lung microenvironment. Using this strategy to screen a library of epigenetically targeted compounds, we identified inhibitors of CDK12 to be most effective, reducing OS cell outgrowth in the lung by more than 90% at submicromolar doses. We found that knockout of CDK12 in an in vivo model of lung metastasis significantly decreased the ability of OS to colonize the lung. CDK12 inhibition led to defects in transcription elongation in a gene length- and expression-dependent manner. These effects were accompanied by defects in RNA processing and altered the expression of genes involved in transcription regulation and the DNA damage response. We further identified OS models that differ in their sensitivity to CDK12 inhibition in the lung and provided evidence that upregulated MYC levels may mediate these differences. Our studies provided a framework for rapid preclinical testing of compounds with antimetastatic activity and highlighted CDK12 as a potential therapeutic target in OS.

Keywords: Cancer; Drug screens; Epigenetics; Genetics; Oncology.


Conflict of interest statement

Conflict of interest: REG is a member of the scientific advisory board of the Global Gene Corporation.

Figures

Figure 1
Figure 1. An ex vivo screen identifies compounds that inhibit the growth of metastatic OS.
(A) Outline of the PuMA screen. (B) Left: 96-well plate of lung explants seeded with metastatic OS cells. Center, left: magnified view of 4 individual wells. Fluorescence image of a lung explant seeded with GFP+ OS cells (top center) and corresponding false colored image used for quantification (top right). Bottom center: ×40 magnification of H&E-stained, control-treated lung section after 14 days in PuMA explant culture. Boxed region highlights area of extensive OS cell growth. Bottom right: ×200 magnification of boxed region. (C) Distribution of 112 of the compounds tested, according to class. (D) Fluorescence image of a 96-well plate of lung explants treated for 14 days with 2 doses (high and low) of each compound or vehicle control (DMSO, white boxes). Called hits are boxed in red. Each row (M1–M8) is from a single mouse. (E) Dot plot showing results of all compounds tested at all doses. The dashed line corresponds to 90% reduction of GFP+ area compared with DMSO controls after 14 days of treatment in the PuMA model.
Figure 2
Figure 2. CDK inhibitors reduce metastatic cell outgrowth in the lung microenvironment.
(A) Heatmap showing IC50 values for the CDK inhibitors tested, as determined by Selleck chemicals. NN, not determined. Concentrations tested for each compound are represented by the sizes of the squares within the boxes. Percentage death refers to the reduction of the GFP+ area in the compound vs. DMSO control–treated cells at low and high doses. The left side of the gray-red boxes corresponds to the percentage of cell death achieved with the low dose; the right side denotes the percentage of death achieved with the high dose. Right, compound concentrations and corresponding percentages of cell death achieved in a secondary assessment of 7 initial hits. (B) Top: representative GFP images of lung explants seeded with either MG63.3 or 143B cells and treated with the indicated CDK inhibitors for 14 days. Bottom: GFP-based quantification of lung explants from the respective cell line, treated with indicated compound. Data are presented as mean ± SD with at least 3 explants per condition. Ordinary 1-way ANOVA with Tukey’s multiple comparisons test was used to compare across groups. **P < 0.01. Original magnification, ×2. (C) Top: drawing of in vivo CRISPR CDK12 knockout experiment. Middle: quantification of GFP+ area of lungs from each mouse in the experiment. Four to five images were taken per set of lungs and quantified for GFP+ area using ImageJ. Filled dots indicate those in the representative images. Bottom: representative images from indicated lungs. Original magnification, ×2. Data are represented as mean ± SD. Ordinary 1-way ANOVA with Tukey’s multiple comparisons test was used to compare across groups. **P < 0.01.
Figure 3
Figure 3. THZ531 and E9 show broad activity against OS cell-line models.
(A) Dose-response curves for OS cells treated with increasing concentrations of THZ531 (left) or E9 (right) for 72 hours. Percentage of cell viability relative to DMSO-treated cells is shown. The data are presented as mean ± SD of triplicate points. (B) Analysis of target engagement in MG63.3 cells following THZ531 or E9 treatment. Cells were treated with THZ531/E9 or DMSO for 6 hours at the indicated concentrations and cell lysates incubated with 1 μM of biotinylated THZ1 (bio-THZ1) overnight, followed by Western blotting to detect CDK12. (C) Colony-formation assays of MG63.3 and 143B cell lines treated with different concentrations of E9 for 12 days. Representative examples are shown (left), with quantification on the right. Results are expressed as mean ± SD. n = 3. **P < 0.01; ****P < 0.0001, 1-way ANOVA with Dunnett’s multiple comparison correction. (D) Western blot analysis of cleaved PARP1 in the indicated cells following treatment with E9 at the indicated doses and times. GAPDH, loading control. (E) Cell-cycle analysis of MG63.3 and 143B cells exposed to 400 nM of E9 for 24 and 48 hours by flow cytometry with propidium iodide (PI) staining. The scale and axes are indicated in the lower left corner. (F) Flow cytometry analysis of γ-H2AX staining in MG63.3 and 143B cells treated with 400 nM E9 for the indicated times.
Figure 4
Figure 4. E9 treatment impairs transcription elongation in OS cells.
(A) Western blot analysis of the indicated proteins in 143B and MG63.3 cells treated with DMSO or increasing concentrations of E9 at 6 and 24 hours. GAPDH, loading control. (B) Representative browser views of ChIP-Seq data at the SLC38A1 locus. (C) Windowed heatmaps showing H3K27ac, CDK12, RNA Pol2, and RNA Pol2 Ser2 ChIP-Seq signals ± 5 kb from the TSS in 143B cell line. Below are aggregate plots showing the respective ChIP-Seq signals for the heatmaps depicted above. (D) Metagene analysis of Ser2 ChIP-Seq signal across all genes sorted in descending order based on the average signal per binned region. Windows include 1 kb upstream of the TSS and 1 kb downstream of the TES. (E) Browser views of Ser2 ChIP-Seq signal at RUNX1 and FOS loci in DMSO- and E9-treated OS cells.
Figure 5
Figure 5. E9 affects transcript levels in a gene-length– and expression-dependent manner.
(A) Left: volcano plot of RNA-Seq–based expression differences between E9 and DMSO control–treated 143B cells. 1275 Genes showed a decrease of more than 2 fold (q value < 0.05). RNA-Seq for the cell line and condition was performed in triplicate. Right: violin plot of gene sizes for the indicated gene categories in 143B cells. Mann-Whitney U test was used to determine significance. *P < 0.001. (B) GO scores and associated terms from of all genes downregulated more than 2-fold in 143B cells using EnrichR. Terms are ranked based on EnrichR combined scores. (C) Heatmaps of Ser2 ChIP-Seq signal across all expressed genes in DMSO- and E9-treated 143B cells, ranked by gene size. Aggregate plots are shown above. Plotted on the immediate right are corresponding fold changes in transcript levels upon E9 treatment. The line plot on the far right denotes baseline transcript levels and E9-treated transcript levels. All genes are ordered similarly in all plots. (D) Heatmap of Ser2 ChIP-Seq signal in MG63.3 cells in a metagene analysis ± 1 kb of all active genes of the indicated size, ranked by size. Aggregate plots are shown above. (E) Heatmap of Ser2 ChIP-Seq signal in DMSO- and E9-treated 143B cells. Ser2 signals –5 kb and +20 kb of TSSs are shown for all active genes up to 20 kb in length, sorted by increasing gene length. Dark blue signal that runs diagonally from the top to the bottom of the left heatmap corresponds to TESs. (F) Browser view of Ser2 ChIP-Seq and RNA-Seq reads of EGR1 (left) and SKI (right) in E9-and DMSO-treated cells.
Figure 6
Figure 6. High levels of MYC correlate with insensitivity of OS cells to E9 treatment ex vivo.
(A) CNAs in MG63.3 cells (E9 resistant) relative to 143B cells (E9 sensitive) from whole-genome–sequencing data. (B) Cone plot of H3K27ac SE signals across the epigenomes of MG63.3 and 143B cell lines. (C) Browser views of H3K27ac ChIP-Seq signals at the MYC locus. SE identified in each cell line are indicated. (D) MYC transcript levels in MG63.3 and 143B OS cells cultured in vitro as well as at 1 and 14 days in PuMA model. (E) Relative growth of MG63.3 cells in PuMA lung explants after treatment with the indicated compounds compared with control. Data are presented as mean ± SD of triplicate lung sections. *P < 0.05 versus DMSO control by ordinary 1-way ANOVA with Tukey’s multiple comparison testing.

References

    1. Valastyan S, Weinberg RA. Tumor metastasis: molecular insights and evolving paradigms. Cell. 2011;147(2):275–292. doi: 10.1016/j.cell.2011.09.024. - DOI - PMC - PubMed
    1. Mirabello L, Troisi RJ, Savage SA. Osteosarcoma incidence and survival rates from 1973 to 2004: data from the Surveillance, Epidemiology, and End Results Program. Cancer. 2009;115(7):1531–1543. doi: 10.1002/cncr.24121. - DOI - PMC - PubMed
    1. Perkins SM, Shinohara ET, DeWees T, Frangoul H. Outcome for children with metastatic solid tumors over the last four decades. PLoS ONE. 2014;9(7):e100396. doi: 10.1371/journal.pone.0100396. - DOI - PMC - PubMed
    1. Meyers PA, et al. Osteosarcoma: a randomized, prospective trial of the addition of ifosfamide and/or muramyl tripeptide to cisplatin, doxorubicin, and high-dose methotrexate. J Clin Oncol. 2005;23(9):2004–2011. doi: 10.1200/JCO.2005.06.031. - DOI - PubMed
    1. Meyers PA, et al. Osteogenic sarcoma with clinically detectable metastasis at initial presentation. J Clin Oncol. 1993;11(3):449–453. doi: 10.1200/JCO.1993.11.3.449. - DOI - PubMed

Publication types

MeSH terms

Substances