. 2020 Jan 1;201(1):33-46.
doi: 10.1164/rccm.201807-1370OC.

Platelet Extracellular Vesicles Drive Inflammasome-IL-1β-Dependent Lung Injury in Sickle Cell Disease

Affiliations

Platelet Extracellular Vesicles Drive Inflammasome-IL-1β-Dependent Lung Injury in Sickle Cell Disease

Ravi Vats et al. Am J Respir Crit Care Med. .

Abstract

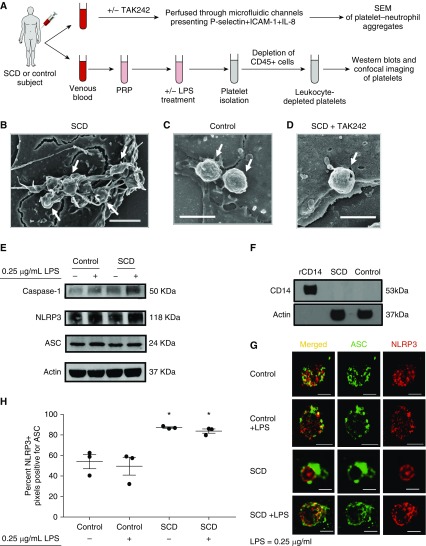
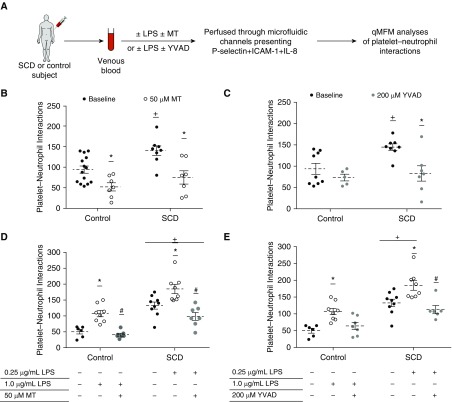
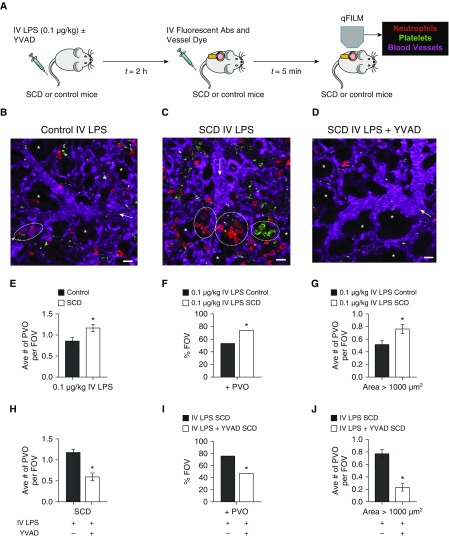
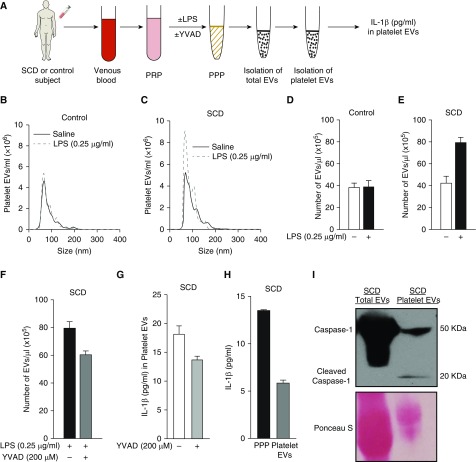
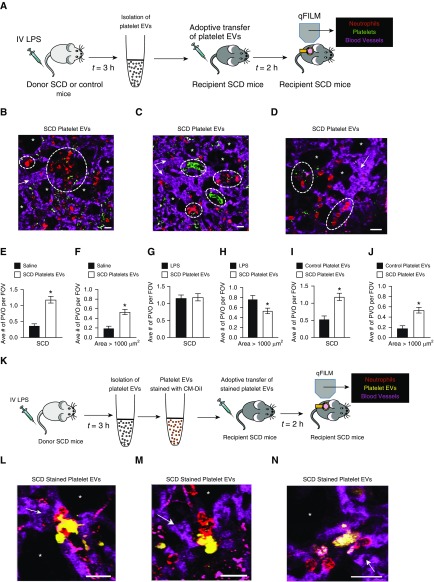
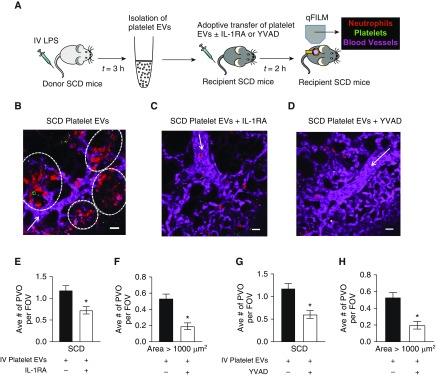
Rationale: Intraerythrocytic polymerization of Hb S promotes hemolysis and vasoocclusive events in the microvasculature of patients with sickle cell disease (SCD). Although platelet-neutrophil aggregate-dependent vasoocclusion is known to occur in the lung and contribute to acute chest syndrome, the etiological mechanisms that trigger acute chest syndrome are largely unknown.Objectives: To identify the innate immune mechanism that promotes platelet-neutrophil aggregate-dependent lung vasoocclusion and injury in SCD.Methods:In vivo imaging of the lung in transgenic humanized SCD mice and in vitro imaging of SCD patient blood flowing through a microfluidic system was performed. SCD mice were systemically challenged with nanogram quantities of LPS to trigger lung vasoocclusion.Measurements and Main Results: Platelet-inflammasome activation led to generation of IL-1β and caspase-1-carrying platelet extracellular vesicles (EVs) that bind to neutrophils and promote platelet-neutrophil aggregation in lung arterioles of SCD mice in vivo and SCD human blood in microfluidics in vitro. The inflammasome activation, platelet EV generation, and platelet-neutrophil aggregation were enhanced by the presence of LPS at a nanogram dose in SCD but not control human blood. Inhibition of the inflammasome effector caspase-1 or IL-1β pathway attenuated platelet EV generation, prevented platelet-neutrophil aggregation, and restored microvascular blood flow in lung arterioles of SCD mice in vivo and SCD human blood in microfluidics in vitro.Conclusions: These results are the first to identify that platelet-inflammasome-dependent shedding of IL-1β and caspase-1-carrying platelet EVs promote lung vasoocclusion in SCD. The current findings also highlight the therapeutic potential of targeting the platelet-inflammasome-dependent innate immune pathway to prevent acute chest syndrome.

Keywords: acute chest syndrome; neutrophil–platelet aggregates; vasoocclusion.


Figures

Figure 1.
Figure 1.
Inflammatory milieu in sickle cell disease (SCD) promotes activation of platelet inflammasome. (A) Experimental scheme #1: SCD or control human blood with or without treatment with TLR4 (toll-like receptor 4) inhibitor TAK242 (50 μg/ml) was perfused through microfluidic flow channels presenting a combination of P-selectin, ICAM-1, and IL-8. Platelet–neutrophil aggregates were fixed under flow and visualized using scanning electron microscopy (SEM). Experimental scheme #2: Platelet-rich plasma (PRP) was prepared from SCD or control human blood. PRPs were left untreated or treated with LPS (0.25 μg/ml). Platelets were isolated from untreated or LPS-treated PRPs and depleted of leukocytes (cluster of differentiation [CD]-45+ cells) before use in Western blots or confocal microscopy. Refer to the online supplement for details. (BD) Scanning electron micrographs show platelets (arrows) nucleated on top of an arrested neutrophil in SCD human blood (B), control human blood (C), and SCD human blood treated with TAK242 (50 μg/ml) (D) (scale bar, 2.5 μm; wall shear stress, 6 dyn ⋅ cm−2). (E) Representative Western blot micrograph shows the presence of NLRP3 (NOD-like receptor family, pyrin domain containing-3) (118 kD), apoptosis-associated speck-like protein containing a caspase recruitment domain (ASC) (24 kD), and caspase-1 (50 kD) in both control and SCD platelets. Complete gels and densitometry analysis are shown in Figure E2 and E3, respectively. (F) Representative Western blot micrograph shows absence of CD14 (53 kD) in SCD and control human platelet samples. Recombinant human CD14 in lane 1 was used as a standard positive control. Complete gels are shown in Figure E4. β-Actin (37 kD) was used as the housekeeping control in E and F. (G) Representative confocal microscopy images shows the colocalization of ASC (green) and NLRP3 (red) in control and SCD platelets with or without treatment with 0.25 μg/ml LPS (scale bars, 2 μm). (H) Confocal images of three cells in each treatment group were analyzed to determine the percentage of NLRP3 positive (red) pixels that were also positive for ASC (green). Each data point represents an individual platelet. Mean values for each group were plotted and compared using the Student’s t test with Bonferroni correction. (BH) Data shown are representative of experiments done with blood samples of two control and two SCD subjects (BD and Figure E1), three control and three SCD subjects (E and Figure E3), one SCD and one control subject (F), and two control and two SCD subjects (GH). *P < 0.05 when compared with control. ICAM-1 = intercellular adhesion molecule-1.
Figure 2.
Figure 2.
Platelet inflammasome promotes platelet–neutrophil aggregation in SCD human blood. (A) Experimental scheme: Either untreated or LPS-treated control and SCD human blood with or without additional treatment with mitochondrial reactive oxygen species scavenger Mitotempo (MT) or caspase-1 inhibitor (YVAD) was perfused through microfluidic flow channels presenting P-selectin, intercellular adhesion molecule-1, and IL-8. Neutrophils were observed to roll, arrest, crawl, and interact with freely flowing platelets, resulting in significantly more platelet–neutrophil interactions in untreated SCD than control blood. Platelet–neutrophil aggregation was assessed using qMFM and compared between groups using the following two parameters: average number of platelets that interact with arrested neutrophils per field of view (FOV; ∼14,520 μm2) over a 2-minute period (shown here) and average number of platelets interacting per arrested neutrophil over a 2-minute period (Figure E7). Wall shear stress is 6 dyn ⋅ cm−2. Refer to the online supplement for details. (B) The effect of MT (50 μM) on platelet–neutrophil interactions per FOV in untreated control and SCD human blood is shown. (C) The effect of YVAD (200 μM) on platelet–neutrophil interactions per FOV in untreated control and SCD human blood is shown. (D and E) As depicted in the experimental scheme, experiments shown in B and C were also repeated with control and SCD human blood pretreated with 1 μg/ml and 0.25 μg/ml LPS, respectively. Refer to the online supplement for details. (D) The effect of MT (50 μM) on platelet–neutrophil interactions per FOV and (E) the effect of YVAD (200 μM) on platelet–neutrophil interactions per FOV in control and SCD human blood pretreated with 1 μg/ml and 0.25 μg/ml of LPS, respectively, are shown. Means were compared using the Student’s t test with Bonferroni correction for multiple comparisons. Each data point in BE represents total interactions in an FOV. (BE) Data are representative of four control human subjects and three human subjects with SCD (B), three control human subjects and four human subjects with SCD (C), three control human subjects and three human subjects with SCD (D), and four control human subjects and four human subjects with SCD (E). #P < 0.05 when compared with LPS, *P < 0.05 when compared with baseline, and +P < 0.05 when compared with control. ICAM-1 = intercellular adhesion molecule-1; qMFM = quantitative microfluidic fluorescence microscopy; SCD = sickle cell disease.
Figure 3.
Figure 3.
Inflammasome inhibition prevents pulmonary vasoocclusion (PVO) in SCD mice in vivo. (A) Experimental scheme: Control and SCD mice were intravenously administered 0.1 μg/kg LPS ± 0.002 μmol/kg caspase-1 inhibitor YVAD, and qFILM was used to assess the absence or presence of platelet–neutrophil aggregate–mediated PVO. Representative fields of view (FOVs; ∼65,536 μm2) are shown in BD. (B) Intravenous LPS led to minimal vasoocclusion in control mice (a small platelet–neutrophil aggregate blocking the arteriolar bottleneck marked by dotted circle). As shown in Video E1, circulating neutrophils still transit through the other unoccluded arteriolar branch, suggesting that fewer and smaller platelet–neutrophil aggregates in control mice minimally obstructed the pulmonary blood flow. (C) Intravenous LPS led to occlusion of arteriolar bottlenecks in the lung of SCD mice by large platelet–neutrophil aggregates (aggregates marked by dotted white circles). As seen in Video E2, the three neutrophil–platelet aggregates block the blood flow from the arteriolar branches into the capillaries, which is evident by the back-and-forth movement of cells in the main arteriole. (D) Caspase-1 inhibition abolished intravenous LPS-triggered platelet–neutrophil aggregation in the lungs of SCD mice, resulting in an absence of vasoocclusion from the majority of FOVs. The complete time series for BD are shown in Videos E1–E3, respectively. Pulmonary microcirculation (pseudocolor purple), neutrophils (red), and platelets (pseudocolor green) were labeled in vivo by intravenous administration of fluorescein isothiocyanate dextran, AF546-Ly6G Ab, and V450-CD49b Ab, respectively. Alveoli are marked with asterisks. White arrows denote the direction of blood flow within the arterioles (scale bars, 20 μm). The diameters of the arterioles shown in BD are 29, 31, and 40 μm, respectively. (EJ) PVOs were quantified as described in the online supplement. Intravenous LPS led to significantly (E) higher average number of PVOs per FOV, (F) higher percentage of FOVs with PVOs, and (G) more large PVOs with areas > 1,000 μm2 in SCD compared with control mice. Caspase-1 inhibition with YVAD significantly reduced (H) the average number of PVOs per FOV, (I) the percentage of FOVs with PVOs, and (J) large PVOs with area > 1,000 μm2 in SCD mice administered intravenous LPS with YVAD compared with SCD mice administered intravenous LPS only. The average number of PVOs per FOV and large PVOs (area > 1,000 μm2) were compared between groups using the unpaired Student’s t test, and the percentage of FOVs with PVOs were compared between groups using fourfold table analyses. Error bars are SE. The following were administered: intravenous LPS control (n = 5 mice; 113 FOVs); intravenous LPS SCD (n = 5 mice; 116 FOVs); and intravenous LPS with YVAD SCD (n = 3 mice; 64 FOVs). *P < 0.05. Abs = antibodies; IV = intravenous; qFILM = quantitative fluorescence intravital lung microscopy; SCD = sickle cell disease; YVAD = caspase-1 inhibitor.
Figure 4.
Figure 4.
Inflammasome promotes generation of IL-1β and caspase-1–carrying platelet extracellular vesicles (EVs) in SCD. (A) Experimental scheme: Platelet-rich plasma (PRP) was prepared from control and SCD human blood. PRPs were either left untreated or treated with 0.25 μg/ml LPS in the absence or presence of caspase-1 inhibitor YVAD (200 μM) and processed to generate platelet-poor plasma (PPP). PPPs were used for isolation and quantification of total and platelet-derived EVs. IL-1β content in platelet EVs was estimated using ELISA. Refer to the online supplement for details on EV isolation and quantification. Nanoparticle tracking analysis was used to estimate the size distribution and concentration of platelet EVs. Representative nanoparticle tracking analysis data are shown for platelet EVs isolated from saline (solid curve) or 0.25 μg/ml LPS-treated (dashed curve) PRP of (B) a control and (C) an SCD human subject. (DF) Although incubation with 0.25 μg/ml LPS did not promote EV generation by platelets in control human PRP (D), it led to a twofold increase in EVs in SCD human PRP (E), which was reduced after treatment with YVAD (F). (G) IL-1β was present in platelet-derived EVs isolated from SCD human PRP, and the levels were reduced after pretreatment with YVAD. (H) SCD human PRP treated with 0.25 μg/ml LPS was processed to generate PPP. PPP was used for isolation of platelet-derived EVs. IL-1β content in PPP and platelet EVs isolated from same PPP was compared using ELISA and reported as picograms per milliliter of PPP. Approximately 50% of IL-1β in PPP was bound to platelet EVs. (I) SCD human PRP treated with LPS (0.25 μg/ml) was processed to isolate total and platelet-derived EVs using the method described in the online supplement. EVs were lysed and used in Western blot analysis to detect caspase-1 using polyclonal rabbit anti–human caspase-1 antibody (Clone #2225; Cell Signaling Tech). Western blot micrograph showing caspase-1 (50 kD) was present in both total and platelet EVs, and cleaved caspase-1 (20 kD) was detectable in platelet EVs. Ponceau S was used as the loading control. Complete gel is shown in Figure E13. Each bar in DH represents mean ± SE of three repetitions. Data in BI are representative of experiments done with blood samples of four human subjects with SCD and two control human subjects. SCD = sickle cell disease; YVAD = caspase-1 inhibitor.
Figure 5.
Figure 5.
Platelet extracellular vesicles (EVs) promote lung vasoocclusion in SCD mice in vivo. (A) Experimental scheme #1: Donor SCD or control mice were intravenously administered LPS (1 μg/kg); platelet EVs were isolated from the blood and adoptively (intravenously) transferred into unchallenged recipient SCD mice. Lung vasoocclusion was assessed in recipient mice using quantitative fluorescence intravital lung microscopy (qFILM) and compared with lung vasoocclusion in SCD mice administered intravenous LPS or saline. Refer to the online supplement for details. (BD) Three representative qFILM images reveal large neutrophil–platelet aggregates (marked by dashed white circles) blocking arteriolar bottlenecks in the lung of recipient SCD mice intravenously administered SCD platelet EVs. Videos E5–E7 show the complete time series of fields of view (FOVs) shown in BD. Intravenous administration of SCD platelet EVs caused a significant increase in the (E) average number of pulmonary vasoocclusions (PVOs) per FOV and (F) large PVOs (area > 1,000 μm2) per FOV in recipient SCD mice compared with intravenous saline. (G) The average number of PVOs per FOV was not different and (H) large PVOs (area > 1,000 μm2) per FOV were slightly reduced in recipient SCD mice administered SCD platelet EVs compared with SCD mice administered 0.1 μg/kg LPS. Both (I) the average number of PVOs per FOV and (J) large PVOs (area > 1,000 μm2) per FOV were significantly greater in recipient SCD mice administered SCD platelet EVs compared with recipient SCD mice administered control platelet EVs. The following were administered: saline (n = 5 mice; 81 FOVs), 0.1 μg/kg LPS (n = 5 mice; 116 FOVs), SCD platelet EVs (n = 6 mice; 87 FOVs), and control platelet EVs (n = 4 mice; 51 FOVs). The average number of PVOs per FOV and large PVOs (area > 1,000 μm2) per FOV were compared between groups using the unpaired Student’s t test. Error bars are SE. Pulmonary microcirculation (pseudocolor purple), neutrophils (red), and platelets (pseudocolor green) are shown. The diameters of the arterioles in BD are 37, 38, and 33 μm, respectively. (K) Experimental scheme #2: Experiments described in scheme #1 were repeated with SCD platelet EVs stained with chloromethyl-dialkylcarbocyanine (CM-DiI). (LN) Three representative qFILM images show SCD platelet EVs (yellow) bound to neutrophil aggregates (red) in the lung arterioles (purple) of recipient SCD mice intravenously administered CM-DiI-stained SCD platelet EVs. Videos E9–E11 show the complete time series of FOVs shown in LN, respectively. Platelet staining with V450-CD49b Ab was skipped in these experiments and, therefore, platelets are not visible in LN and Videos E9–E11. Pulmonary microcirculation (fluorescein isothiocyanate dextran, pseudocolor purple), neutrophils (Pacific Blue Ly6G Ab, pseudocolor red), and platelet EVs (CM-DiI, pseudocolor yellow) are shown. Alveoli are marked with asterisks. The white arrows denote the direction of blood flow (scale bars, 20 μm). *P < 0.05. IV = intravenous; SCD = sickle cell disease.
Figure 6.
Figure 6.
Platelet extracellular vesicle (EV)-induced lung vasoocclusion is IL-1β and caspase-1 dependent. (A) Experimental scheme: Donor SCD mice were intravenously administered LPS (1 μg/kg); platelet EVs were isolated from the blood and adoptively (intravenously) transferred into unchallenged recipient SCD mice without (n = 6 mice; 87 fields of view [FOVs]) or with (n = 5 mice; 76 FOVs) 10 mg/kg IL-1 receptor antagonist (IL-1RA), or 0.004 μmol/kg caspase-1 inhibitor YVAD (n = 5 mice; 68 FOVs). Lung vasoocclusion was assessed in recipient mice using qFILM. Refer to the online supplement for details. Representative qFILM images reveal (B) presence of large neutrophil–platelet aggregates (marked by dashed white circles) blocking arteriolar bottlenecks in the lung of a recipient SCD mouse intravenously administered SCD platelet EVs and (C and D) absence of platelet–neutrophil aggregates in the lung of a recipient SCD mouse intravenously administered SCD platelet EVs with IL-1RA or SCD platelet EVs with YVAD. Videos E12–E14 show the complete time series of FOVs shown in BD, respectively. (E) The average number of pulmonary vasoocclusions (PVOs) per FOV and (F) large PVOs (area > 1,000 μm2) per FOV were significantly reduced in recipient SCD mice administered SCD platelet EVs with IL-1RA compared with recipient SCD mice administered SCD platelet EVs only. (G) The average number of PVOs per FOV and (H) large PVOs (area > 1,000 μm2) per FOV were significantly reduced in recipient SCD mice administered SCD platelet EVs with YVAD compared with recipient SCD mice administered SCD platelet EVs only. The average number of PVOs per FOV and large PVOs (area > 1,000 μm2) per FOV were compared between groups using the unpaired Student’s t test. Error bars are SE. Pulmonary microcirculation (pseudocolor purple), neutrophils (red) and platelets (pseudocolor green) are shown. The white arrows denote the direction of blood flow. The diameters of the arterioles in BD are 22, 31, and 35 μm, respectively. Scale bars, 20 μm. *P < 0.05. IV = intravenous; qFILM = quantitative fluorescence intravital lung microscopy; SCD = sickle cell disease.

Comment in

References

    1. Rees DC, Williams TN, Gladwin MT. Sickle-cell disease. Lancet. 2010;376:2018–2031. - PubMed
    1. Mortality GBD GBD 2013 Mortality and Causes of Death Collaborators. Global, regional, and national age-sex specific all-cause and cause-specific mortality for 240 causes of death, 1990-2013: a systematic analysis for the Global Burden of Disease Study 2013. Lancet. 2015;385:117–171. - PMC - PubMed
    1. Frenette PS, Atweh GF. Sickle cell disease: old discoveries, new concepts, and future promise. J Clin Invest. 2007;117:850–858. - PMC - PubMed
    1. Miller AC, Gladwin MT. Pulmonary complications of sickle cell disease. Am J Respir Crit Care Med. 2012;185:1154–1165. - PMC - PubMed
    1. Chaturvedi S, Ghafuri DL, Glassberg J, Kassim AA, Rodeghier M, DeBaun MR. Rapidly progressive acute chest syndrome in individuals with sickle cell anemia: a distinct acute chest syndrome phenotype. Am J Hematol. 2016;91:1185–1190. - PubMed

Publication types