

MHC binding affects the dynamics of different T-cell receptors in different ways
- PMID: 31498801
- PMCID: PMC6752857
- DOI: 10.1371/journal.pcbi.1007338
MHC binding affects the dynamics of different T-cell receptors in different ways
Abstract
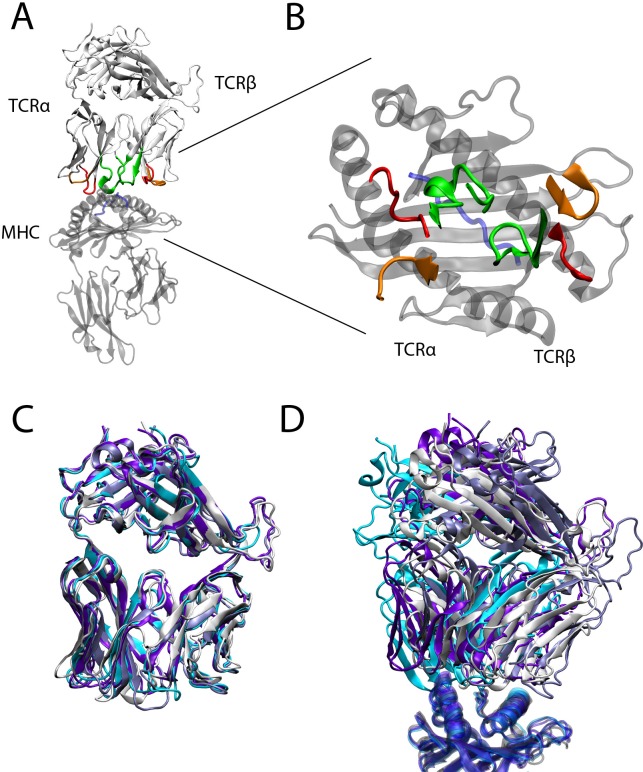
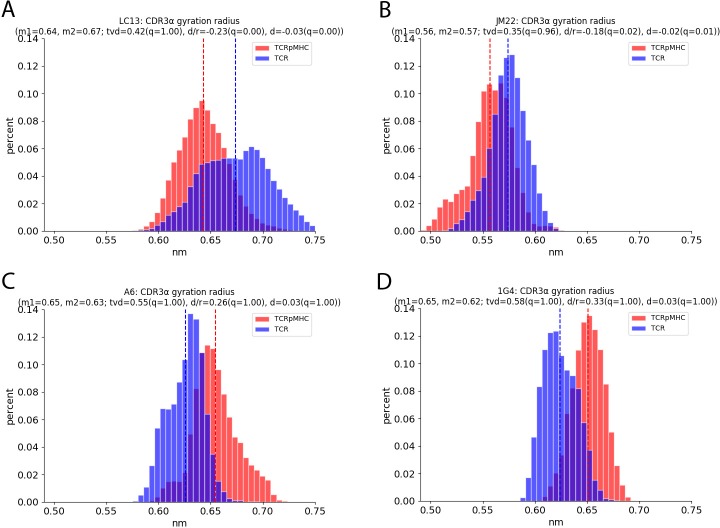
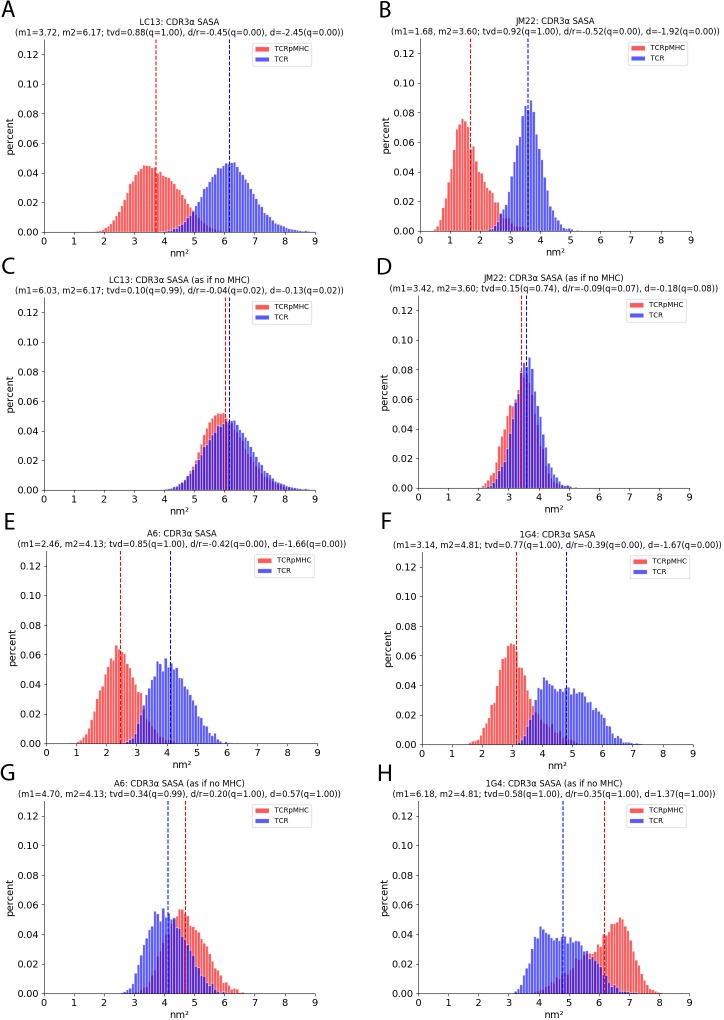
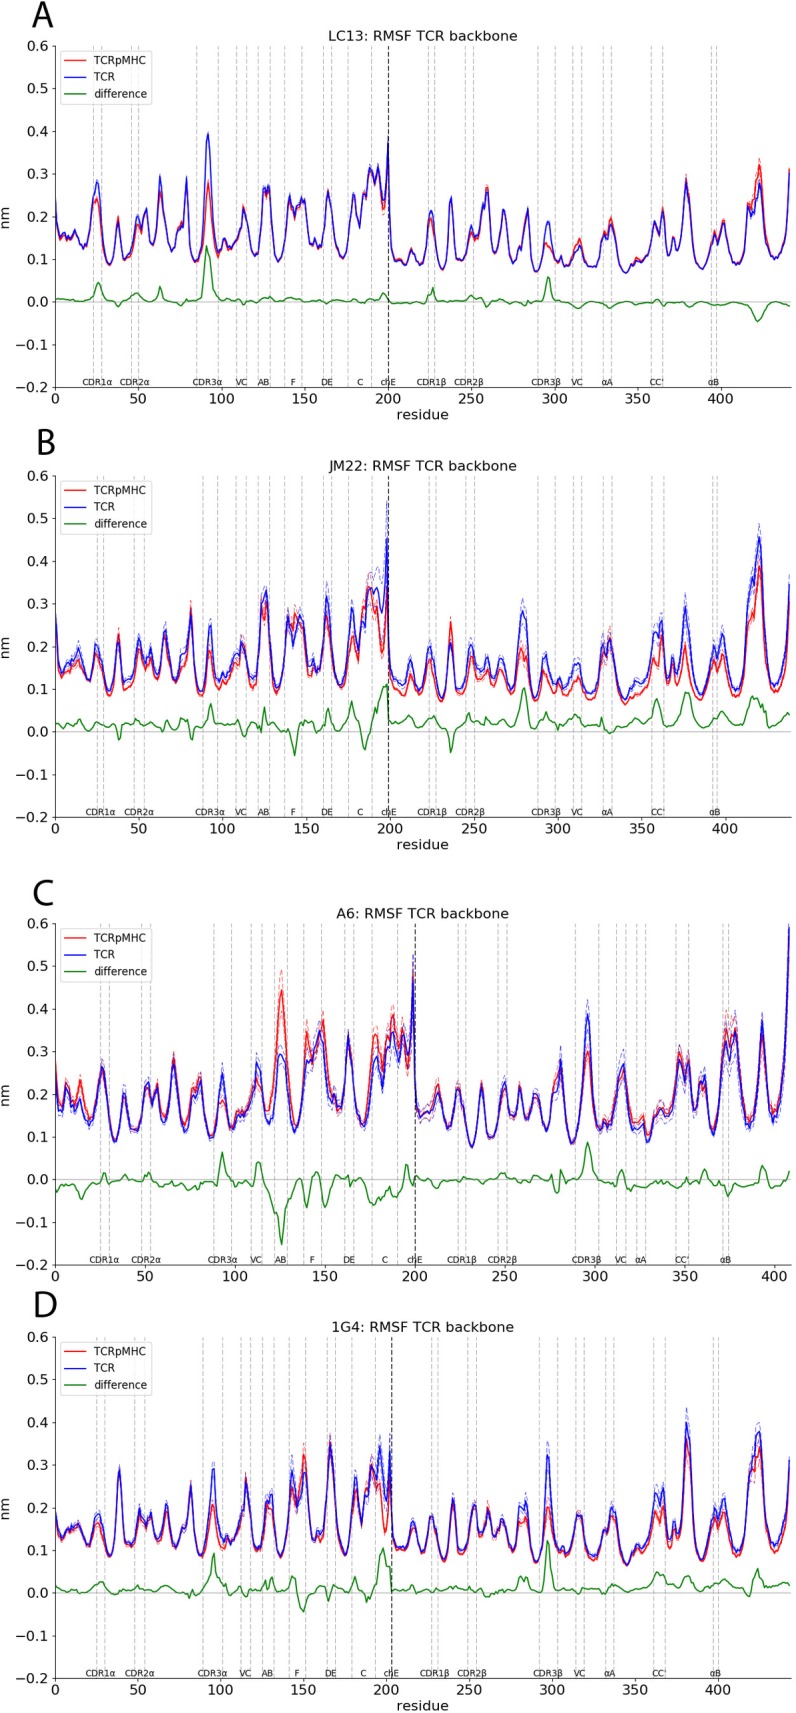
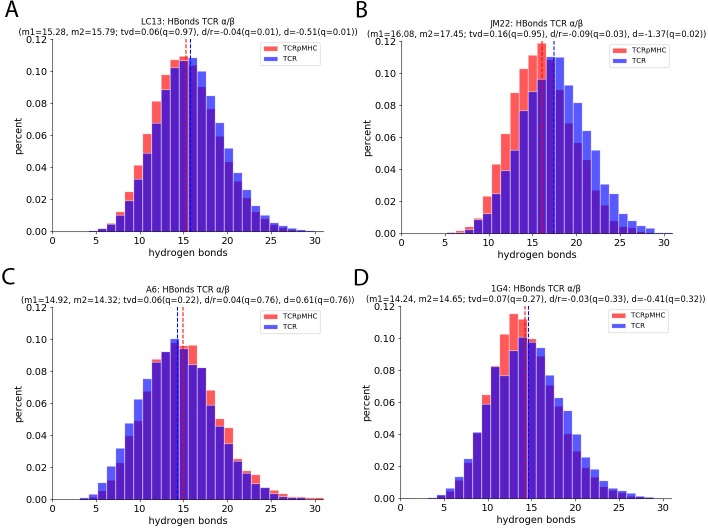
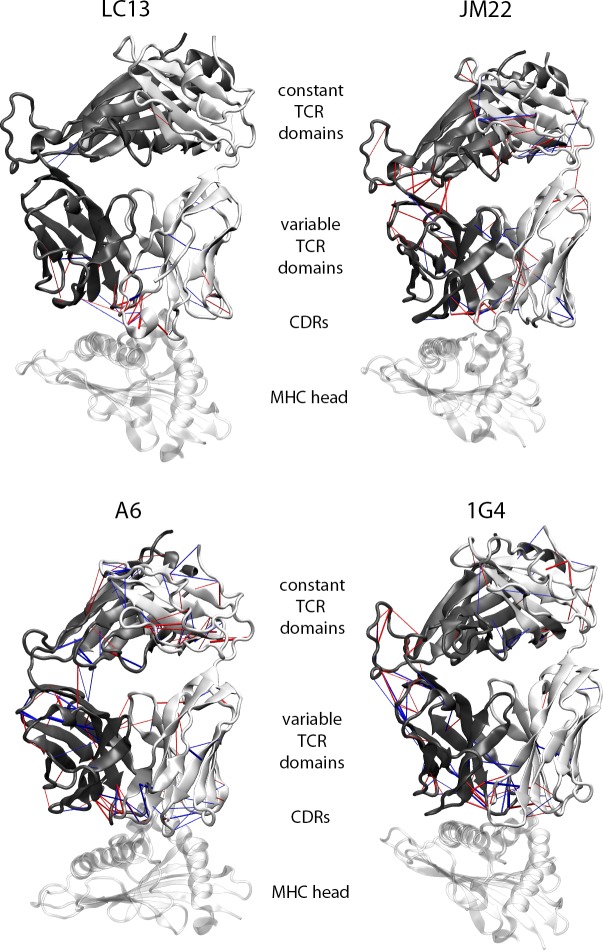
T cells use their T-cell receptors (TCRs) to scan other cells for antigenic peptides presented by MHC molecules (pMHC). If a TCR encounters a pMHC, it can trigger a signalling pathway that could lead to the activation of the T cell and the initiation of an immune response. It is currently not clear how the binding of pMHC to the TCR initiates signalling within the T cell. One hypothesis is that conformational changes in the TCR lead to further downstream signalling. Here we investigate four different TCRs in their free state as well as in their pMHC bound state using large scale molecular simulations totalling 26 000 ns. We find that the dynamical features within TCRs differ significantly between unbound TCR and TCR/pMHC simulations. However, apart from expected results such as reduced solvent accessibility and flexibility of the interface residues, these features are not conserved among different TCR types. The presence of a pMHC alone is not sufficient to cause cross-TCR-conserved dynamical features within a TCR. Our results argue against models of TCR triggering involving conserved allosteric conformational changes.
Conflict of interest statement
The authors have declared that no competing interests exist.
Figures

Similar articles
-
How peptide/MHC presence affects the dynamics of the LC13 T-cell receptor.Sci Rep. 2019 Feb 25;9(1):2638. doi: 10.1038/s41598-019-38788-0. Sci Rep. 2019. PMID: 30804417 Free PMC article.
-
Peptide-MHC Binding Reveals Conserved Allosteric Sites in MHC Class I- and Class II-Restricted T Cell Receptors (TCRs).J Mol Biol. 2020 Dec 4;432(24):166697. doi: 10.1016/j.jmb.2020.10.031. Epub 2020 Nov 4. J Mol Biol. 2020. PMID: 33157083 Free PMC article.
-
Conformational flexibility of a free and TCR-bound pMHC-I protein investigated by long-term molecular dynamics simulations.BMC Immunol. 2022 Jul 29;23(Suppl 1):36. doi: 10.1186/s12865-022-00510-7. BMC Immunol. 2022. PMID: 35902791 Free PMC article.
-
Modulation of T cell function by TCR/pMHC binding kinetics.Immunobiology. 2006;211(1-2):47-64. doi: 10.1016/j.imbio.2005.09.003. Epub 2006 Jan 4. Immunobiology. 2006. PMID: 16446170 Review.
-
Codification of bidentate pMHC interaction with TCR and its co-receptor.Trends Immunol. 2015 May;36(5):300-6. doi: 10.1016/j.it.2015.03.004. Epub 2015 Mar 26. Trends Immunol. 2015. PMID: 25818864 Free PMC article. Review.
Cited by
-
Identification of a Clade-Specific HLA-C*03:02 CTL Epitope GY9 Derived from the HIV-1 p17 Matrix Protein.Int J Mol Sci. 2024 Sep 6;25(17):9683. doi: 10.3390/ijms25179683. Int J Mol Sci. 2024. PMID: 39273630 Free PMC article.
-
Generation of neoantigen-specific T cells for adoptive cell transfer for treating head and neck squamous cell carcinoma.Oncoimmunology. 2021 May 25;10(1):1929726. doi: 10.1080/2162402X.2021.1929726. Oncoimmunology. 2021. PMID: 34104546 Free PMC article.
-
Identification and In Silico Characterization of a Conserved Peptide on Influenza Hemagglutinin Protein: A New Potential Antigen for Universal Influenza Vaccine Development.Nanomaterials (Basel). 2023 Oct 20;13(20):2796. doi: 10.3390/nano13202796. Nanomaterials (Basel). 2023. PMID: 37887946 Free PMC article.
-
Sequential immunotherapy: towards cures for autoimmunity.Nat Rev Drug Discov. 2024 Jul;23(7):501-524. doi: 10.1038/s41573-024-00959-8. Epub 2024 Jun 5. Nat Rev Drug Discov. 2024. PMID: 38839912 Review.
-
T-Cell Receptor CDR3 Loop Conformations in Solution Shift the Relative Vα-Vβ Domain Distributions.Front Immunol. 2020 Jul 8;11:1440. doi: 10.3389/fimmu.2020.01440. eCollection 2020. Front Immunol. 2020. PMID: 32733478 Free PMC article.
References
-
- van der Merwe PA (2001) The TCR triggering puzzle. Immunity 14: 665–668. - PubMed
Publication types
MeSH terms
Substances
Grants and funding
LinkOut - more resources
Full Text Sources
Other Literature Sources
Research Materials
Miscellaneous
