Physiological and molecular responses to drought stress in teak (Tectona grandis L.f.)
- PMID: 31498810
- PMCID: PMC6733471
- DOI: 10.1371/journal.pone.0221571
Physiological and molecular responses to drought stress in teak (Tectona grandis L.f.)
Abstract
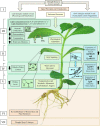
Drought stress is an increasingly common and worrying phenomenon because it causes a loss of production in both agriculture and forestry. Teak is a tropical tree which needs alternating rainy and dry seasons to produce high-quality wood. However, a robust understanding about the physiological characteristics and genes related to drought stress in this species is lacking. Consequently, after applying moderate and severe drought stress to teak seedlings, an infrared gas analyzer (IRGA) was used to measure different parameters in the leaves. Additionally, using the root transcriptome allowed finding and analyzing the expression of several drought-related genes. As a result, in both water deficit treatments a reduction in photosynthesis, transpiration, stomatal conductance and leaf relative water content was found. As well, an increase in free proline levels and intrinsic water use efficiency was found when compared to the control treatment. Furthermore, 977 transcripts from the root contigs showed functional annotation related to drought stress, and of these, TgTPS1, TgDREB1, TgAREB1 and TgPIP1 were selected. The expression analysis of those genes along with TgHSP1, TgHSP2, TgHSP3 and TgBI (other stress-related genes) showed that with moderate treatment, TgTPS1, TgDREB1, TgAREB1, TgPIP1, TgHSP3 and TgBI genes had higher expression than the control treatment, but with severe treatment only TgTPS1 and TgDREB1 showed higher expression than the control treatment. At the end, a schematic model for the physiological and molecular strategies under drought stress in teak from this study is provided. In conclusion, these physiological and biochemical adjustments in leaves and genetic changes in roots under severe and prolonged water shortage situations can be a limiting factor for teak plantlets' growth. Further studies of those genes under different biotic and abiotic stress treatments are needed.
Conflict of interest statement
The authors have declared that no competing interests exist.
Figures


Similar articles
-
Overexpression of TgERF1, a Transcription Factor from Tectona grandis, Increases Tolerance to Drought and Salt Stress in Tobacco.Int J Mol Sci. 2023 Feb 19;24(4):4149. doi: 10.3390/ijms24044149. Int J Mol Sci. 2023. PMID: 36835560 Free PMC article.
-
Large-scale transcriptional profiling of lignified tissues in Tectona grandis.BMC Plant Biol. 2015 Sep 15;15:221. doi: 10.1186/s12870-015-0599-x. BMC Plant Biol. 2015. PMID: 26369560 Free PMC article.
-
Physiological, biochemical and molecular responses in four Prunus rootstocks submitted to drought stress.Tree Physiol. 2013 Oct;33(10):1061-75. doi: 10.1093/treephys/tpt074. Epub 2013 Oct 25. Tree Physiol. 2013. PMID: 24162335
-
Interdependence of plant water status with photosynthetic performance and root defense responses in Vigna radiata (L.) Wilczek under progressive drought stress and recovery.J Photochem Photobiol B. 2013 Oct 5;127:170-81. doi: 10.1016/j.jphotobiol.2013.08.004. Epub 2013 Aug 31. J Photochem Photobiol B. 2013. PMID: 24050991
-
Drought stress-induced physiological mechanisms, signaling pathways and molecular response of chloroplasts in common vegetable crops.Crit Rev Biotechnol. 2021 Aug;41(5):669-691. doi: 10.1080/07388551.2021.1874280. Epub 2021 Feb 1. Crit Rev Biotechnol. 2021. PMID: 33525946 Review.
Cited by
-
Enhancing cold and drought tolerance in cotton: a protective role of SikCOR413PM1.BMC Plant Biol. 2023 Nov 18;23(1):577. doi: 10.1186/s12870-023-04572-6. BMC Plant Biol. 2023. PMID: 37978345 Free PMC article.
-
Overexpression of TgERF1, a Transcription Factor from Tectona grandis, Increases Tolerance to Drought and Salt Stress in Tobacco.Int J Mol Sci. 2023 Feb 19;24(4):4149. doi: 10.3390/ijms24044149. Int J Mol Sci. 2023. PMID: 36835560 Free PMC article.
-
Photosynthetic Plasticity and Stomata Adjustment in Chromosome Segment Substitution Lines of Rice Cultivar KDML105 under Drought Stress.Plants (Basel). 2022 Dec 24;12(1):94. doi: 10.3390/plants12010094. Plants (Basel). 2022. PMID: 36616222 Free PMC article.
-
Photosynthetic Performance of Oil Palm Genotypes under Drought Stress.Plants (Basel). 2024 Sep 27;13(19):2705. doi: 10.3390/plants13192705. Plants (Basel). 2024. PMID: 39409575 Free PMC article.
-
Variation in biochemical, physiological and ecophysiological traits among the teak (Tectona grandis Linn. f) seed sources of India.Sci Rep. 2022 Jul 8;12(1):11677. doi: 10.1038/s41598-022-15878-0. Sci Rep. 2022. PMID: 35804090 Free PMC article.
References
-
- Belhassen E. Drought tolerance in higher plants: genetical, physiological and molecular biological analysis 1st ed Belhassen E, editor. Dordrecht: Springer; 1997. 10.1007/978-94-017-1299-6 - DOI
Publication types
MeSH terms
Substances
LinkOut - more resources
Full Text Sources
Research Materials

