. 2019 Sep 9;14(9):e0222191.
doi: 10.1371/journal.pone.0222191. eCollection 2019.

High-throughput sequencing analysis of microbial community diversity in response to indica and japonica bar-transgenic rice paddy soils

Affiliations

High-throughput sequencing analysis of microbial community diversity in response to indica and japonica bar-transgenic rice paddy soils

Meidan He et al. PLoS One. .

Abstract

Potential environmental risks of genetically modified (GM) crops have raised concerns. To better understand the effect of transgenic rice on the bacterial community in paddy soil, a field experiment was carried out using pairs of rice varieties from two subspecies (indica and japonica) containing bar transgene with herbicide resistance and their parental conventional rice. The 16S rRNA gene of soil genomic DNA from different soil layers at the maturity stage was sequenced using high-throughput sequencing on the Illumina MiSeq platform to explore the microbial community diversity among different rice soils. There were no significant differences in diversity indices between transgenic japonica rice and its sister conventional rice (japonica pair) among different soil layers, but, significant differences was observed between transgenic indica rice and its conventional rice (indica pair) in the topsoil layer around concentrated rice roots according to the ace diversity index. Though the japonica rice soil and indica rice soil were shared several key genera, including Rivibacter, Anaeromyxobacter, Roseomonas, Geobacter, Thiobacillus, Clostridium, and Desulfobulbus, the primary bacterial genera in indica rice soil were different from those in japonica rice. Synechococcus and Dechloromonas were present in japonica rice samples, while Chloronema, Flexibacter, and Blastocatella were observed in indica rice soil. Moreover, the abundance of genera between GM and non-GM varieties in japonica rice was significantly different from indica rice, and several bacterial communities influenced these differences. Anaerovorax was more abundant in transgenic japonica rice soil than conventional rice soil, while it was deficient in transgenic indica rice soil compared to conventional rice soil, and opposite responses to Deferrisoma were in that of indica rice. Thus, we concluded that transgenic indica and japonica rice had different effects on soil bacteria compared with their corresponding sister conventional rice. However, these composition and abundance difference only occurred for a few genera but had no effect on the primary genera and soil characteristics were mainly contributed to these differences. Thus, differences in bacterial community structure can be ignored when evaluating the impacts of transgenic rice in the complex soil microenvironment.


Conflict of interest statement

The authors have declared that no competing interests exist.

Figures

Fig 1
Fig 1. The primary bacterial genera, shared and unique OTU for three kinds of paddy soils.
(a), the dominant bacterial genus in japonica rice soil. (b), the dominant bacterial genus in indica rice soil. (c), the dominant bacterial genus in blank rice soil. (d), the shared and unique OTU for blank soil, japonica rice soil, and indica rice soil.
Fig 2
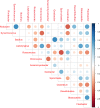
Fig 2. Correlations among the core bacteria.
Correlation of two bacterial genera was shown in locations with crosses. Blue colors showed positive correlations, while reddish hues showed negative correlations; dots with larger diameters showed stronger correlations.
Fig 3
Fig 3. Principal coordinate analysis of different classifications based on weighted UniFrac distance.
(a), principal coordinate analysis of group samples categorized by genetic modification status and rice subspecies. (b), principal coordinate analysis for different groups of rice subspecies. (c), principal coordinate analysis of the GM group samples and non-GM group samples. (d), principal coordinate analysis of topsoil samples and subsoil samples.BS, blank soil; IT, transgenic indica rice, IC, indica rice control; JT, transgenic japonica rice and JC for japonica rice control; JR, japonica rice, IR, indica rice; TR, transgenic rice, CR, conventional rice control; D, subsoil soil; S, topsoil.
Fig 4
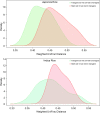
Fig 4. Kernel density estimation of evolutionary distance for transgenic vs non-transgenic and japonica vs indica samples.
Transgene vs No Transgene, Transgenic pair and non-transgenic pair; JR vs IR, japonica pair and indica pair.
Fig 5
Fig 5. Heatmap of the classified bacterial genera of the paddy soil between transgenic and conventional rice.
(a), different bacterial genera between transgenic japonica rice and its conventional rice. (b), different bacterial genera between transgenic indica rice and its conventional rice.
Fig 6
Fig 6. Kernel density estimation of evolutionary distance for two subspecies rice samples.
Fig 7
Fig 7. Correlations between environmental factors and the top 50 most abundant bacterial communities at genus level.
AK, available potassium; AP, available phosphorus; AN, ammonium nitrogen; NN, nitrate nitrogen; OM, organic matter; TK, total potassium; TP, total phosphorus; TN, total nitrogen. The red colors represented positive correlations, while blue colors represented negative correlations. Darker colors represent stronger correlations. Significant differences were represented by: *0.01<p = <0.05, **0.001<p = <0.01, ***p<0.001.

References

    1. James C. Global Status of Commercialized Biotech/GM Crops in 2017:Biotech Crop Adoption Surges as Economic Benefits Accumulate in 22 Years: ISAAA; 2018 [cited 2018 Sep 22]. Available from: http://www.isaaa.org/resources/publications/annualreport/2017/default.asp.
    1. Brookes G, Barfoot P. Economic impact of GM crops: The global income and production effects 1996–2012. Gm Crops & Food. 2014;5(1):65–75. 10.4161/gmcr.28098 - DOI - PMC - PubMed
    1. Lu BR, Yang X, Ellstrand NC. Fitness correlates of crop transgene flow into weedy populations: a case study of weedy rice in China and other examples. Evol Appl. 2016;9(7):857–70. 10.1111/eva.12377 - DOI - PMC - PubMed
    1. Mao J, Sun X, Cheng JH, Shi YJ, Wang XZ, Qin JJ, et al. A 52-week safety study in cynomolgus macaques for genetically modified rice expressing Cry1Ab/1Ac protein. Food Chem Toxicol. 2016;95:1–11. 10.1016/j.fct.2016.06.015 - DOI - PubMed
    1. Domingo JL. Safety assessment of GM plants: An updated review of the scientific literature. Food Chem Toxicol. 2016;95:12–8. 10.1016/j.fct.2016.06.013 - DOI - PubMed

Publication types