G-protein-coupled receptor 40 agonist GW9508 potentiates glucose-stimulated insulin secretion through activation of protein kinase Cα and ε in INS-1 cells
- PMID: 31498851
- PMCID: PMC6733457
- DOI: 10.1371/journal.pone.0222179
G-protein-coupled receptor 40 agonist GW9508 potentiates glucose-stimulated insulin secretion through activation of protein kinase Cα and ε in INS-1 cells
Abstract
Objective: The mechanism by which G-protein-coupled receptor 40 (GPR40) signaling amplifies glucose-stimulated insulin secretion through activation of protein kinase C (PKC) is unknown. We examined whether a GPR40 agonist, GW9508, could stimulate conventional and novel isoforms of PKC at two glucose concentrations (3 mM and 20 mM) in INS-1D cells.
Methods: Using epifluorescence microscopy, we monitored relative changes in the cytosolic fluorescence intensity of Fura2 as a marker of change in intracellular Ca2+ ([Ca2+]i) and relative increases in green fluorescent protein (GFP)-tagged myristoylated alanine-rich C kinase substrate (MARCKS-GFP) as a marker of PKC activation in response to GW9508 at 3 mM and 20 mM glucose. To assess the activation of the two PKC isoforms, relative increases in membrane fluorescence intensity of PKCα-GFP and PKCε-GFP were measured by total internal reflection fluorescence microscopy. Specific inhibitors of each PKC isotype were constructed and synthesized as peptide fusions with the third α-helix of the homeodomain of Antennapedia.
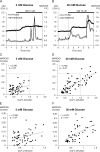
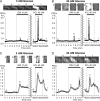
Results: At 3 mM glucose, GW9508 induced sustained MARCKS-GFP translocation to the cytosol, irrespective of changes in [Ca2+]i. At 20 mM glucose, GW9508 induced sustained MARCKS-GFP translocation but also transient translocation that followed sharp increases in [Ca2+]i. Although PKCα translocation was rarely observed, PKCε translocation to the plasma membrane was sustained by GW9508 at 3 mM glucose. At 20 mM glucose, GW9508 induced transient translocation of PKCα and sustained translocation as well as transient translocation of PKCε. While the inhibitors (75 μM) of each PKC isotype reduced GW9508-potentiated, glucose-stimulated insulin secretion in INS-1D cells, the PKCε inhibitor had a more potent effect.
Conclusion: GW9508 activated PKCε but not PKCα at a substimulatory concentration of glucose. Both PKC isotypes were activated at a stimulatory concentration of glucose and contributed to glucose-stimulated insulin secretion in insulin-producing cells.
Conflict of interest statement
The authors have declared that no competing interests exist.
Figures


Similar articles
-
Glucagon-like peptide 1 activates protein kinase C through Ca2+-dependent activation of phospholipase C in insulin-secreting cells.J Biol Chem. 2006 Sep 29;281(39):28499-507. doi: 10.1074/jbc.M604291200. Epub 2006 Jul 26. J Biol Chem. 2006. PMID: 16870611
-
Bimodal role of conventional protein kinase C in insulin secretion from rat pancreatic beta cells.J Physiol. 2004 Nov 15;561(Pt 1):133-47. doi: 10.1113/jphysiol.2004.071241. Epub 2004 Sep 23. J Physiol. 2004. PMID: 15388777 Free PMC article.
-
Pharmacological regulation of insulin secretion in MIN6 cells through the fatty acid receptor GPR40: identification of agonist and antagonist small molecules.Br J Pharmacol. 2006 Jul;148(5):619-28. doi: 10.1038/sj.bjp.0706770. Epub 2006 May 15. Br J Pharmacol. 2006. PMID: 16702987 Free PMC article.
-
GW9508 inhibits insulin secretion by activating ATP-sensitive potassium channels in rat pancreatic β-cells.J Mol Endocrinol. 2013 Jun 1;51(1):69-77. doi: 10.1530/JME-13-0019. Print 2013. J Mol Endocrinol. 2013. PMID: 23628491
-
A cancer-associated, genome protective programme engaging PKCε.Adv Biol Regul. 2020 Dec;78:100759. doi: 10.1016/j.jbior.2020.100759. Epub 2020 Oct 7. Adv Biol Regul. 2020. PMID: 33039823 Free PMC article. Review.
Cited by
-
Agonism of Gpr40 Protects the Capacities of Epidermal Stem Cells (ESCs) Against Ultraviolet-B (UV-B).Drug Des Devel Ther. 2020 Nov 24;14:5143-5153. doi: 10.2147/DDDT.S252060. eCollection 2020. Drug Des Devel Ther. 2020. PMID: 33262575 Free PMC article.
-
Activation of GPR40 Suppresses AGE-Induced Reduction of Type II Collagen and Aggrecan in Human SW1353 Chondrocytes.Drug Des Devel Ther. 2020 Jun 15;14:2371-2379. doi: 10.2147/DDDT.S239273. eCollection 2020. Drug Des Devel Ther. 2020. PMID: 32606604 Free PMC article.
-
The Pancreatic β-Cell: The Perfect Redox System.Antioxidants (Basel). 2021 Jan 29;10(2):197. doi: 10.3390/antiox10020197. Antioxidants (Basel). 2021. PMID: 33572903 Free PMC article. Review.
References
MeSH terms
Substances
LinkOut - more resources
Full Text Sources
Miscellaneous

