. 2020 Jan;41(1):17-29.
doi: 10.1002/hbm.24784. Epub 2019 Sep 9.

Neural oscillations and connectivity characterizing the state of tonic experimental pain in humans

Affiliations

Neural oscillations and connectivity characterizing the state of tonic experimental pain in humans

Moritz M Nickel et al. Hum Brain Mapp. 2020 Jan.

Abstract

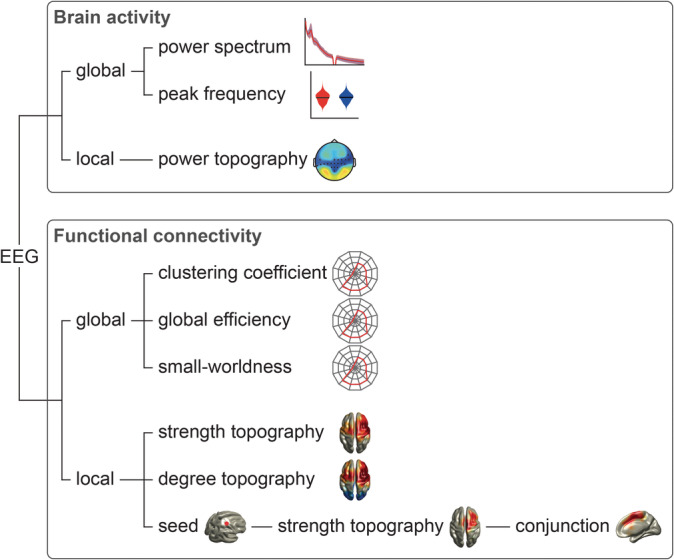
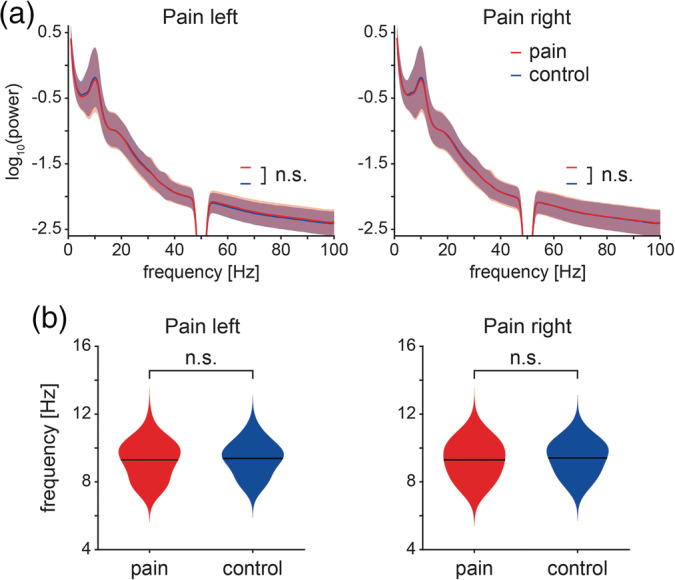
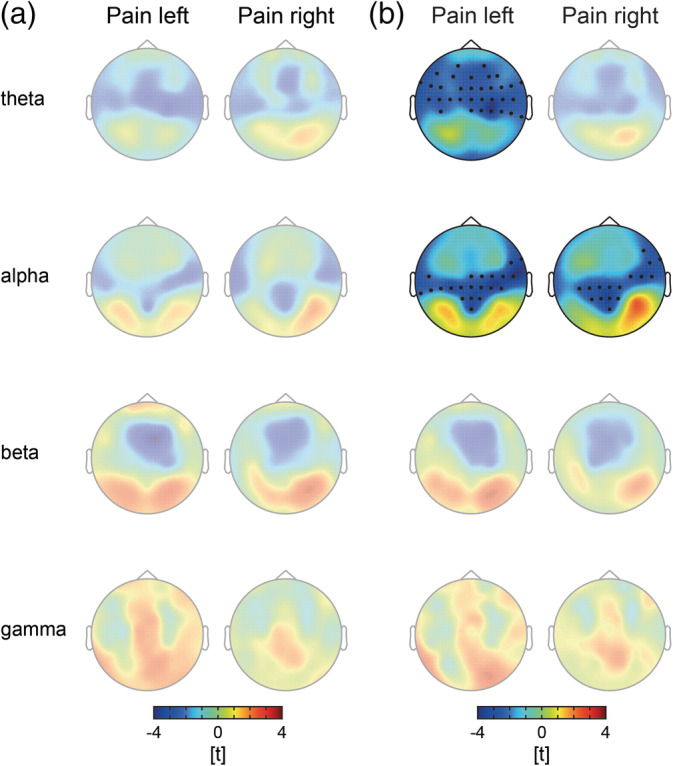
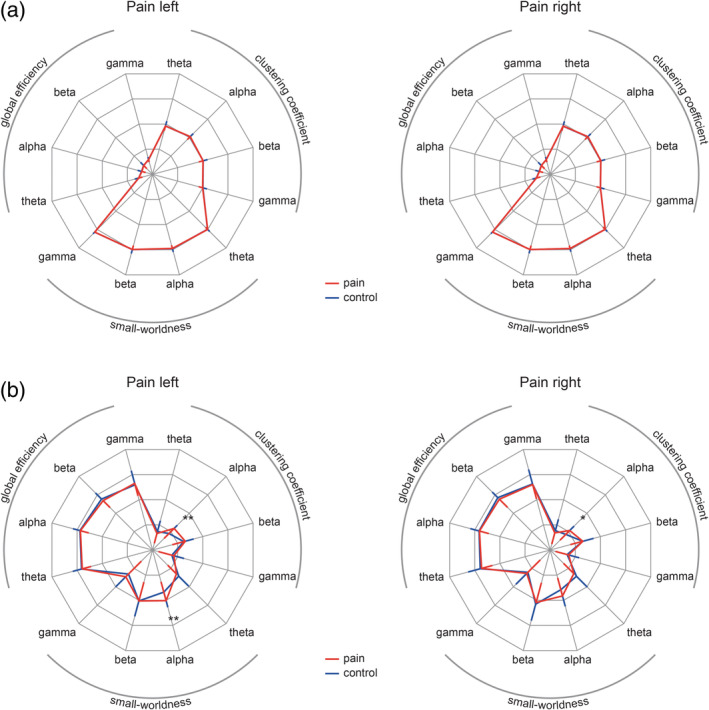
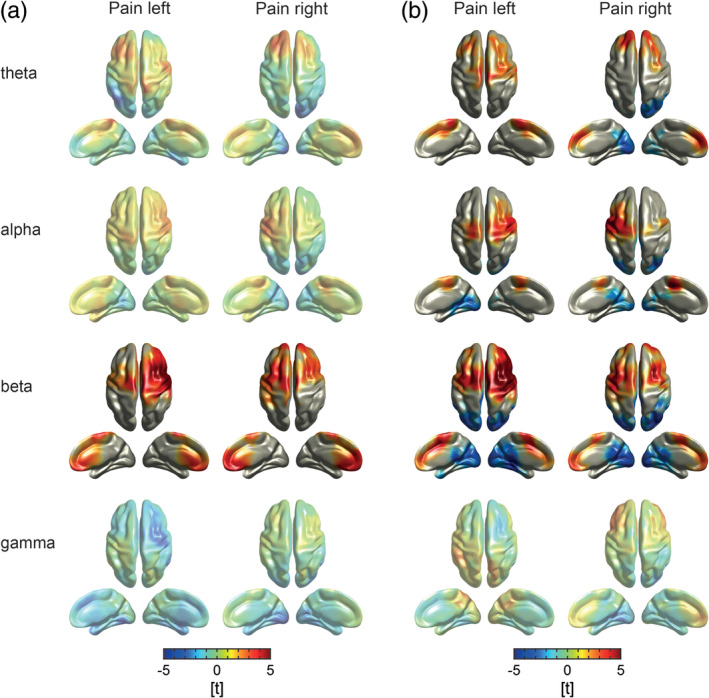
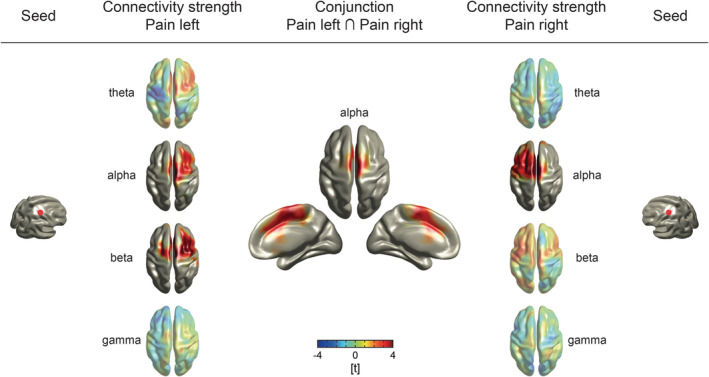
Pain is a complex phenomenon that is served by neural oscillations and connectivity involving different brain areas and frequencies. Here, we aimed to systematically and comprehensively assess the pattern of neural oscillations and connectivity characterizing the state of tonic experimental pain in humans. To this end, we applied 10-min heat pain stimuli consecutively to the right and left hand of 39 healthy participants and recorded electroencephalography. We systematically analyzed global and local measures of oscillatory brain activity, connectivity, and graph theory-based network measures during tonic pain and compared them to a nonpainful control condition. Local measures showed suppressions of oscillatory activity at alpha frequencies together with stronger connectivity at alpha and beta frequencies in sensorimotor areas during tonic pain. Furthermore, sensorimotor areas contralateral to stimulation showed significantly increased connectivity to a common area in the medial prefrontal cortex at alpha frequencies. Together, these observations indicate that the state of tonic experimental pain is associated with a sensorimotor-prefrontal network connected at alpha frequencies. These findings represent a step further toward understanding the brain mechanisms underlying long-lasting pain states in health and disease.

Keywords: brain networks; electroencephalography; functional connectivity; graph theory; neuronal oscillations; tonic pain.


Figures

Figure 1
Figure 1
Analysis outline. EEG data were analyzed with respect to oscillatory brain activity and functional connectivity, as measured by phase locking value (Lachaux, Rodriguez, Martinerie, & Varela, 1999) and debiased weighted phase lag index (Vinck, Oostenveld, van Wingerden, Battaglia, & Pennartz, 2011). For both phenomena, global and local measures were computed. EEG, electroencephalography
Figure 2
Figure 2
Global measures of oscillatory brain activity. (a) Absolute power spectra of pain (red) and control conditions (blue) for stimulation of the left and right hand. Individual power spectra were log‐transformed and averaged for visualization. The red and the blue shading indicate the SD across subjects. Cluster‐based permutation tests showed no significant differences between pain and respective control conditions. (b) Violin plots of the dominant peak frequencies of pain (red) and control (blue) conditions. Peak frequencies between 6 and 14 Hz were determined on single‐trial level to avoid a bias toward trials with high alpha power. Subsequently, single‐trial peak frequencies were averaged for each participant and condition. Black lines indicate the grand average of dominant peak frequencies across participants. Nonparametric permutation tests showed no significant differences between pain and control conditions
Figure 3
Figure 3
Local measures of oscillatory brain activity. (a) T‐maps of absolute power contrasts. Warm and cold colors indicate increased and decreased power in the pain condition as compared to the control condition, respectively. No significant differences in absolute power were revealed by cluster‐based permutation tests after Bonferroni correction. (b) T‐maps of relative power contrasts. Warm and cold colors indicate increased and decreased relative power in the pain condition as compared to the control condition, respectively. With regard to relative alpha power, cluster‐based permutation tests revealed significant decreases over the sensorimotor area (Bonferroni‐corrected) in both pain conditions. Moreover, a significant decrease in the theta frequency band was observed at fronto‐central and fronto‐lateral electrodes in the pain left condition. Topographies without significant cluster are presented with reduced opacity
Figure 4
Figure 4
Global measures of functional connectivity. Radar charts depict global graph measures clustering coefficient, global efficiency, and small‐worldness (S) for all conditions and frequency bands. Red lines indicate pain conditions and blue lines indicate control conditions. Error bars represent the SD for the pain conditions (red, inward oriented) and control conditions (blue, outward oriented). (a) PLV‐based global graph measures are shown with a scale ranging from 0.4 (center point) to 0.8 in steps of 0.1. For visualization purposes, small‐worldness was scaled by a factor of 1/7. None of the PLV‐based graph measures differed significantly between pain and control conditions for any of the investigated frequency bands. (b) dwPLI‐based global graph measures are shown with a scale ranging from 0.2 (center point) to 0.6 in steps of 0.1. For visualization purposes, small‐worldness was scaled by a factor of 1/7. The global clustering coefficient in the alpha band was significantly increased in both pain conditions. Furthermore, small‐worldness was increased in the pain left condition. *p < .05, **p < .01. dwPLI, debiased weighted phase lag index; PLV, phase locking value
Figure 5
Figure 5
Local measures of functional connectivity. (a) T‐maps of functional connectivity contrasts between pain and control conditions. Strength of connectivity of each voxel was computed by averaging the connectivity, as measured by the PLV, of each voxel to all other voxels. Warm and cold colors indicate increased and decreased strength of connectivity in the pain condition as compared to the control condition, respectively. In the beta frequency band, connectivity was increased in both pain conditions predominantly contralateral to the stimulated hand (Bonferroni‐corrected). (b) T‐maps of degree contrasts between pain and control conditions. The degree of an individual node is defined by the number of nodes connected to it after thresholding to the 10% strongest connections. Warm colors indicate an enhanced degree in the pain condition whereas cold colors indicate lower degree in the pain condition as compared to the control condition. The contrasts revealed a higher degree in the sensorimotor cortex contralateral to the stimulation in the alpha and beta frequency bands in both pain conditions (Bonferroni‐corrected). In the theta frequency band, we observed an increase in degree predominantly in bilateral prefrontal cortices. Moreover, we observed a lower degree in occipital cortices at alpha and beta frequencies in both pain conditions (Bonferroni‐corrected). Topographies without significant cluster are presented with reduced opacity. PLV, phase locking value
Figure 6
Figure 6
Seed‐based connectivity analysis. Functional connectivity, as measured by the PLV, was computed using voxels in the contralateral primary somatosensory cortices as seeds (MNIxyz = [30/−30, −30, 60] [Bradley et al., 2017]). T‐maps of the seed‐based connectivity contrasts between pain and control conditions are depicted (left and right side). Warm and cold colors indicate enhanced and reduced functional connectivity in the pain condition as compared to the control condition, respectively. In both pain conditions, we observed increased connectivity between the somatosensory seed voxel and the medial prefrontal cortex and the frontal cortex contralateral to the stimulation side in the alpha frequency band. Moreover, a positive effect at beta frequencies was revealed in the pain left condition. As shown by the conjunction analysis (middle), increased alpha connectivity overlapped in the medial prefrontal cortex which indicates its involvement in the processing of tonic pain independent of the stimulation side. Topographies without significant cluster are presented with reduced opacity. PLV, phase locking value

References

    1. Achard, S. , & Bullmore, E. (2007). Efficiency and cost of economical brain functional networks. PLoS Computational Biology, 3(2), e17 10.1371/journal.pcbi.0030017 - DOI - PMC - PubMed
    1. Apkarian, A. V. , & Chialvo, D. R. (2006). The shadows of pain. Pain, 123(3), 221–222. 10.1016/j.pain.2006.04.028 - DOI - PubMed
    1. Baccala, L. A. , & Sameshima, K. (2001). Partial directed coherence: A new concept in neural structure determination. Biological Cybernetics, 84(6), 463–474. 10.1007/PL00007990 - DOI - PubMed
    1. Baliki, M. N. , & Apkarian, A. V. (2015). Nociception, pain, negative moods, and behavior selection. Neuron, 87(3), 474–491. 10.1016/j.neuron.2015.06.005 - DOI - PMC - PubMed
    1. Baliki, M. N. , Chialvo, D. R. , Geha, P. Y. , Levy, R. M. , Harden, R. N. , Parrish, T. B. , & Apkarian, A. V. (2006). Chronic pain and the emotional brain: Specific brain activity associated with spontaneous fluctuations of intensity of chronic back pain. The Journal of Neuroscience, 26(47), 12165–12173. 10.1523/JNEUROSCI.3576-06.2006 - DOI - PMC - PubMed

Publication types