Comparison of simultaneous arterial spin labeling MRI and 15O-H2O PET measurements of regional cerebral blood flow in rest and altered perfusion states
- PMID: 31500521
- PMCID: PMC7370368
- DOI: 10.1177/0271678X19874643
Comparison of simultaneous arterial spin labeling MRI and 15O-H2O PET measurements of regional cerebral blood flow in rest and altered perfusion states
Abstract
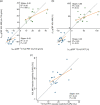
Arterial spin labelling (ASL) is a non-invasive magnetic resonance imaging (MRI) technique that may provide fully quantitative regional cerebral blood flow (rCBF) images. However, before its application in clinical routine, ASL needs to be validated against the clinical gold standard, 15O-H2O positron emission tomography (PET). We aimed to compare the two techniques by performing simultaneous quantitative ASL-MRI and 15O-H2O-PET examinations in a hybrid PET/MRI scanner. Duplicate rCBF measurements were performed in healthy young subjects (n = 14) in rest, during hyperventilation, and after acetazolamide (post-ACZ), yielding 63 combined PET/MRI datasets in total. Average global CBF by ASL-MRI and 15O-H2O-PET was not significantly different in any state (40.0 ± 6.5 and 40.6 ± 4.1 mL/100 g/min, respectively in rest, 24.5 ± 5.1 and 23.4 ± 4.8 mL/100 g/min, respectively, during hyperventilation, and 59.1 ± 10.4 and 64.7 ± 10.0 mL/100 g/min, respectively, post-ACZ). Overall, strong correlation between the two methods was found across all states (slope = 1.01, R2 = 0.82), while the correlations within individual states and of reactivity measures were weaker, in particular in rest (R2 = 0.05, p = 0.03). Regional distribution was similar, although ASL yielded higher perfusion and absolute reactivity in highly vascularized areas. In conclusion, ASL-MRI and 15O-H2O-PET measurements of rCBF are highly correlated across different perfusion states, but with variable correlation within and between hemodynamic states, and systematic differences in regional distribution.
Keywords: 15O-H2O-PET; Arterial spin labeling; PET/MRI; cerebral blood flow; perfusion.
Figures


Similar articles
-
Cerebrovascular reactivity measurements using simultaneous 15O-water PET and ASL MRI: Impacts of arterial transit time, labeling efficiency, and hematocrit.Neuroimage. 2021 Jun;233:117955. doi: 10.1016/j.neuroimage.2021.117955. Epub 2021 Mar 11. Neuroimage. 2021. PMID: 33716155 Free PMC article.
-
Phase contrast mapping MRI measurements of global cerebral blood flow across different perfusion states - A direct comparison with 15O-H2O positron emission tomography using a hybrid PET/MR system.J Cereb Blood Flow Metab. 2019 Dec;39(12):2368-2378. doi: 10.1177/0271678X18798762. Epub 2018 Sep 11. J Cereb Blood Flow Metab. 2019. PMID: 30200799 Free PMC article. Clinical Trial.
-
Quantification of cerebral blood flow in healthy volunteers and type 1 diabetic patients: comparison of MRI arterial spin labeling and [(15)O]H2O positron emission tomography (PET).J Magn Reson Imaging. 2014 Dec;40(6):1300-9. doi: 10.1002/jmri.24484. Epub 2013 Nov 8. J Magn Reson Imaging. 2014. PMID: 24214919 Clinical Trial.
-
Brain PET and functional MRI: why simultaneously using hybrid PET/MR systems?Q J Nucl Med Mol Imaging. 2017 Dec;61(4):345-359. doi: 10.23736/S1824-4785.17.03008-4. Epub 2017 Jul 27. Q J Nucl Med Mol Imaging. 2017. PMID: 28750494 Review.
-
Mapping of cerebral perfusion territories using territorial arterial spin labeling: techniques and clinical application.NMR Biomed. 2013 Aug;26(8):901-12. doi: 10.1002/nbm.2836. Epub 2012 Jul 15. NMR Biomed. 2013. PMID: 22807022 Review.
Cited by
-
Brain Frontal-Lobe Misery Perfusion in COVID-19 ICU Survivors: An MRI Pilot Study.Brain Sci. 2024 Jan 18;14(1):94. doi: 10.3390/brainsci14010094. Brain Sci. 2024. PMID: 38248309 Free PMC article.
-
Insight Into the Effects of Clinical Repetitive Transcranial Magnetic Stimulation on the Brain From Positron Emission Tomography and Magnetic Resonance Imaging Studies: A Narrative Review.Front Neurosci. 2022 Feb 21;16:787403. doi: 10.3389/fnins.2022.787403. eCollection 2022. Front Neurosci. 2022. PMID: 35264923 Free PMC article. Review.
-
Contribution of Inflammation and Hypoperfusion to White Matter Hyperintensities-Related Cognitive Impairment.Front Neurol. 2022 Jan 4;12:786840. doi: 10.3389/fneur.2021.786840. eCollection 2021. Front Neurol. 2022. PMID: 35058875 Free PMC article.
-
Cerebrovascular reactivity measurements using simultaneous 15O-water PET and ASL MRI: Impacts of arterial transit time, labeling efficiency, and hematocrit.Neuroimage. 2021 Jun;233:117955. doi: 10.1016/j.neuroimage.2021.117955. Epub 2021 Mar 11. Neuroimage. 2021. PMID: 33716155 Free PMC article.
-
No Immediate Effects of Transcranial Direct Current Stimulation at Various Intensities on Cerebral Blood Flow in People with Multiple Sclerosis.Brain Sci. 2020 Feb 4;10(2):82. doi: 10.3390/brainsci10020082. Brain Sci. 2020. PMID: 32033094 Free PMC article.
References
-
- Raichle ME, Martin WRW, Herscovitch P, et al.Brain Blood Flow Measured with Intravenous H215O. II. Implementation and Validation. J Nucl Med 1983; 24: 790–798. - PubMed
-
- Rostrup E, Knudsen GM, Law I, et al.The relationship between cerebral blood flow and volume in humans. Neuroimage 2005; 24: 1–11. - PubMed
Publication types
MeSH terms
Substances
LinkOut - more resources
Full Text Sources
Medical

