Comparative Study
. 2019 Sep 9;20(1):194.
doi: 10.1186/s13059-019-1795-z.

A comparison of automatic cell identification methods for single-cell RNA sequencing data

Affiliations
Comparative Study

A comparison of automatic cell identification methods for single-cell RNA sequencing data

Tamim Abdelaal et al. Genome Biol. .

Abstract

Background: Single-cell transcriptomics is rapidly advancing our understanding of the cellular composition of complex tissues and organisms. A major limitation in most analysis pipelines is the reliance on manual annotations to determine cell identities, which are time-consuming and irreproducible. The exponential growth in the number of cells and samples has prompted the adaptation and development of supervised classification methods for automatic cell identification.

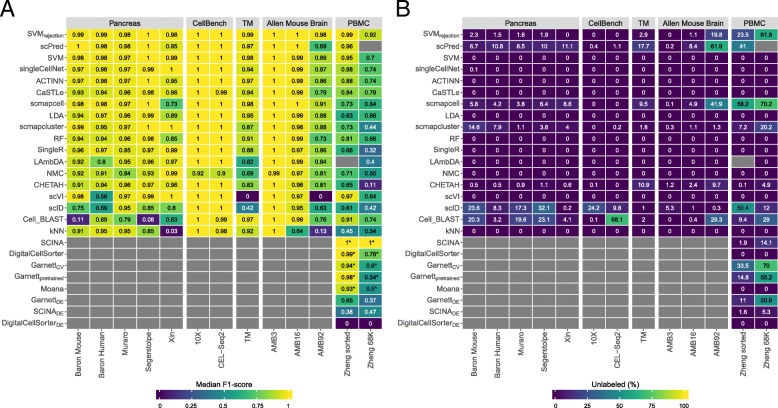
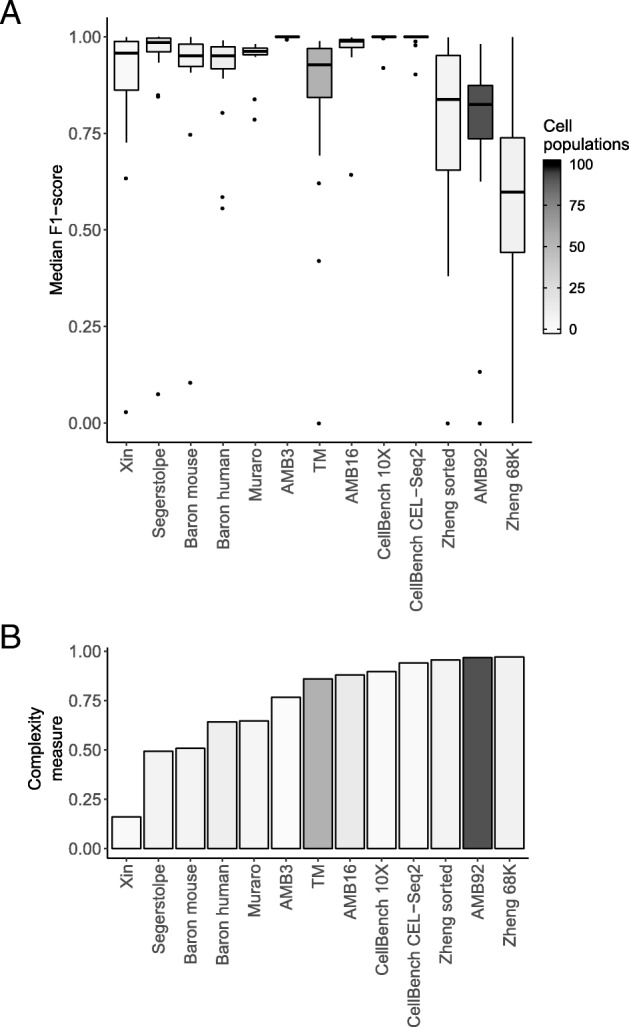
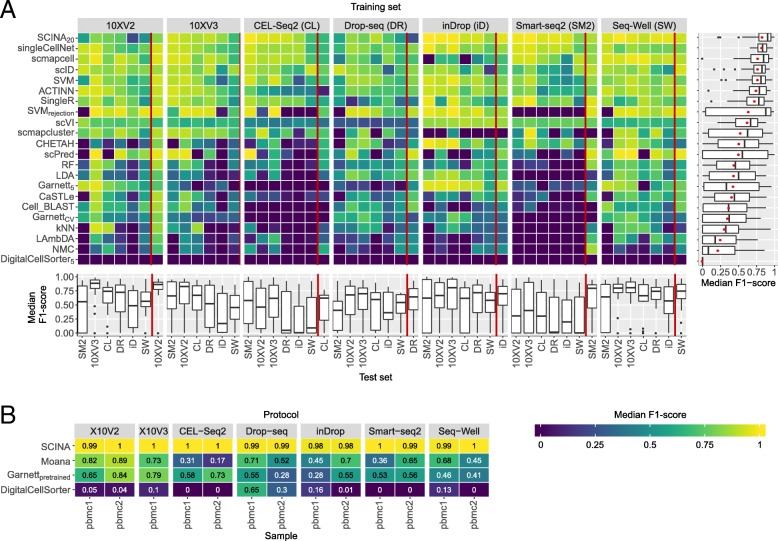
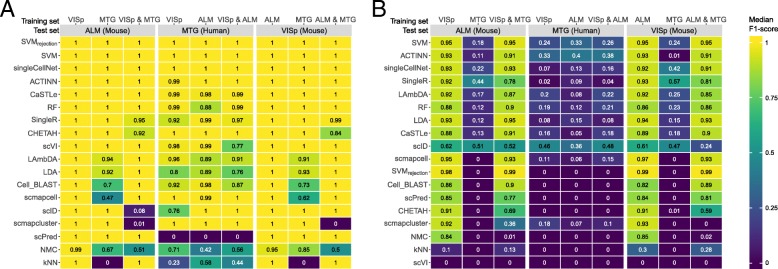
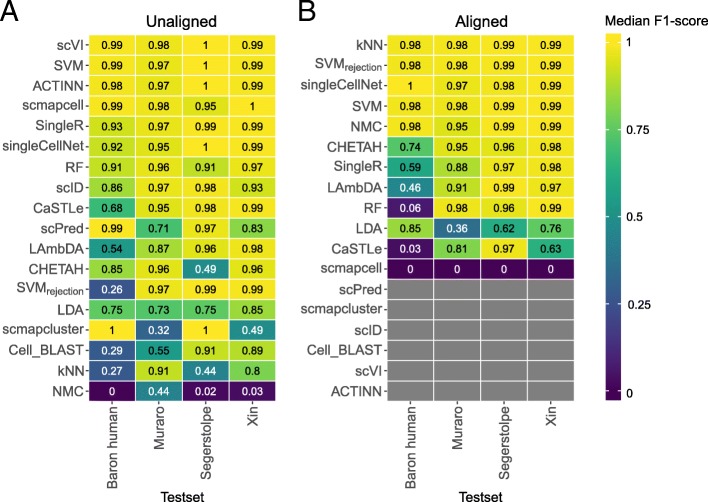
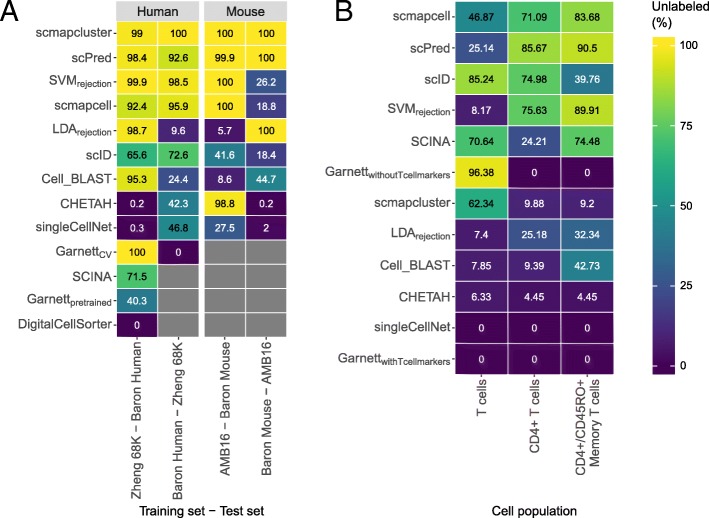
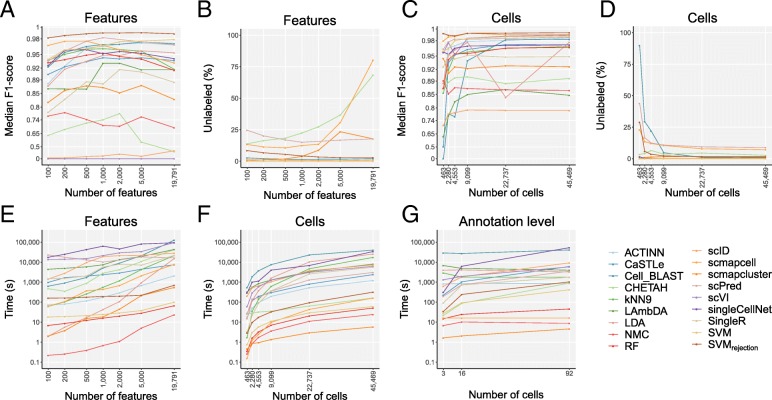
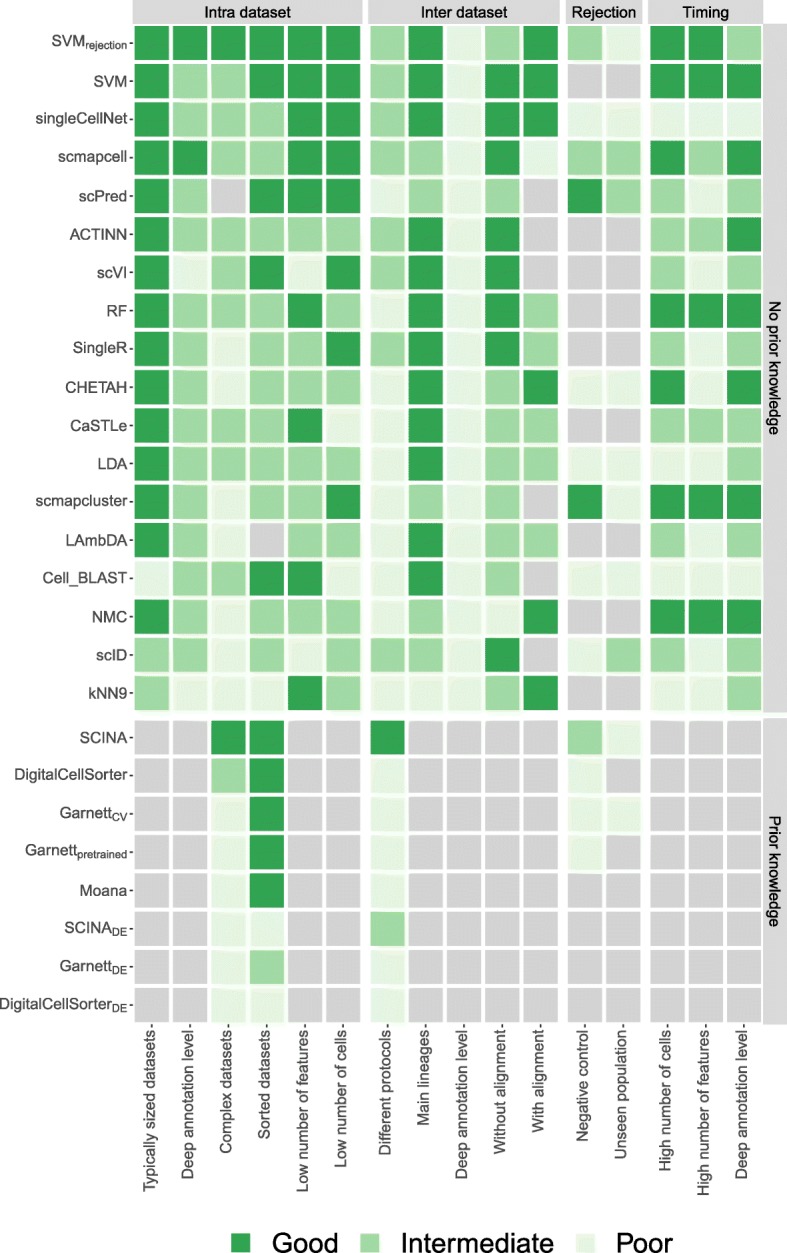
Results: Here, we benchmarked 22 classification methods that automatically assign cell identities including single-cell-specific and general-purpose classifiers. The performance of the methods is evaluated using 27 publicly available single-cell RNA sequencing datasets of different sizes, technologies, species, and levels of complexity. We use 2 experimental setups to evaluate the performance of each method for within dataset predictions (intra-dataset) and across datasets (inter-dataset) based on accuracy, percentage of unclassified cells, and computation time. We further evaluate the methods' sensitivity to the input features, number of cells per population, and their performance across different annotation levels and datasets. We find that most classifiers perform well on a variety of datasets with decreased accuracy for complex datasets with overlapping classes or deep annotations. The general-purpose support vector machine classifier has overall the best performance across the different experiments.

Conclusions: We present a comprehensive evaluation of automatic cell identification methods for single-cell RNA sequencing data. All the code used for the evaluation is available on GitHub ( https://github.com/tabdelaal/scRNAseq_Benchmark ). Additionally, we provide a Snakemake workflow to facilitate the benchmarking and to support the extension of new methods and new datasets.

Keywords: Benchmark; Cell identity; Classification; scRNA-seq.


Conflict of interest statement

The authors declare that they have no competing interests.

Figures

Fig. 1
Fig. 1
Performance comparison of supervised classifiers for cell identification using different scRNA-seq datasets. Heatmap of the a median F1-scores and b percentage of unlabeled cells across all cell populations per classifier (rows) per dataset (columns). Gray boxes indicate that the corresponding method could not be tested on the corresponding dataset. Classifiers are ordered based on the mean of the median F1-scores. Asterisk (*) indicates that the prior-knowledge classifiers, SCINA, DigitalCellSorter, GarnettCV, Garnettpretrained, and Moana, could not be tested on all cell populations of the PBMC datasets. SCINADE, GarnettDE, and DigitalCellSorterDE are versions of SCINA, GarnettCV, and DigitalCellSorter; the marker genes are defined using differential expression from the training data. Different numbers of marker genes, 5, 10, 15, and 20, were tested, and the best result is shown here. SCINA, Garnett, and DigitalCellSorter produced the best result for the Zheng sorted dataset using 20, 15, and 5 markers, and for the Zheng 68K dataset using 10, 5, and 5 markers, respectively
Fig. 2
Fig. 2
Complexity of the datasets compared to the performance of the classifiers. a Boxplots of the median F1-scores of all classifiers for each dataset used during the intra-dataset evaluation. b Barplots describing the complexity of the datasets (see the “Methods” section). Datasets are ordered based on complexity. Box- and bar plots are colored according to the number of cell populations in each dataset
Fig. 3
Fig. 3
Classification performance across the PbmcBench datasets. a Heatmap showing the median F1-scores of the supervised classifiers for all train-test pairwise combination across different protocols. The training set is indicated in the gray box on top of the heatmap, and the test set is indicated using the column labels below. Results shown to the left of the red line represent the comparison between different protocols using sample pbmc1. Results shown to the right of the red line represent the comparison between different samples using the same protocol, with pbmc 1 used for training and pbmc2 used for testing. Boxplots on the right side of the heatmap summarize the performance of each classifier across all experiments. The mean of the median F1-scores, also used to order the classifiers, is indicated in the boxplots using a red dot. Boxplots underneath the heatmap summarize the performance of the classifiers per experiment. For SCINADE, GarnettDE, and DigitalCellSorterDE, different numbers of marker genes were tested. Only the best result is shown here. b Median F1-score of the prior-knowledge classifiers on both samples of the different protocols. The protocol is indicated in the gray box on top of the heatmap, and the sample is indicated with the labels below. Classifiers are ordered based on their mean performance across all datasets
Fig. 4
Fig. 4
Classification performance across brain datasets. Heatmaps show the median F1-scores of the supervised classifiers when tested on a major lineage annotation with three cell populations and b deeper level of annotation with 34 cell populations. The training sets are indicated using the column labels on top of the heatmap. The test set is indicated in the gray box. In each heatmap, the classifiers are ordered based on their mean performance across all experiments
Fig. 5
Fig. 5
Classification performance across pancreatic datasets. Heatmaps showing the median F1-score for each classifier for the a unaligned and b aligned datasets. The column labels indicate which of the four datasets was used as a test set, in which case the other three datasets were used as training. Gray boxes indicate that the corresponding method could not be tested on the corresponding dataset. In each heatmap, the classifiers are ordered based on their mean performance across all experiments
Fig. 6
Fig. 6
Performance of the classifiers during the rejection experiments. a Percentage of unlabeled cells during the negative control experiment for all the classifiers with a rejection option. The prior-knowledge classifiers could not be tested on all datasets, and this is indicated with a gray box. The species of the dataset is indicated in the gray box on top. Column labels indicate which datasets are used for training and testing. b Percentage of unlabeled cells for all classifiers with a rejection option when a cell population was removed from the training set. Column labels indicate which cell population was removed. This cell population was used as a test set. In both a and b, the classifiers are sorted based on their mean performance across all experiments
Fig. 7
Fig. 7
Computation time evaluation across different numbers of features, cells, and annotation levels. Line plots show a the median F1-score, b percentage of unlabeled cells, and e computation time of each classifier applied to the TM dataset with the top 100, 200, 500, 1000, 2000, 5000, and 19,791 (all) genes as input feature sets. Genes were ranked based on dropout-based feature selection. c The median F1-score, d percentage of unlabeled cells, and f computation time of each classifier applied to the downsampled TM datasets containing 463, 2280, 4553, 9099, 22,737, and 45,469 (all) cells. g The computation time of each classifier is plotted against the number of cell populations. Note that the y-axis is 100^x scaled in a and c and log-scaled in eg. The x-axis is log-scaled in af
Fig. 8
Fig. 8
Summary of the performance of all classifiers during different experiments. For each experiment, the heatmap shows whether a classifier performs good, intermediate, or poor. Light gray indicates that a classifier could not be tested during an experiment. The gray boxes to the right of the heatmap indicate the four different categories of experiments: intra-dataset, inter-dataset, rejection, and timing. Experiments itself are indicated using the row labels. Additional file 1: Table S4 shows which datasets were used to score the classifiers exactly for each experiment. Gray boxes above the heatmap indicate the two classifier categories. Within these two categories, the classifiers are sorted based on their mean performance on the intra- and inter-dataset experiments

References

    1. Svensson V, Vento-Tormo R, Teichmann SA. Exponential scaling of single-cell RNA-seq in the past decade. Nat Protoc. 2018;13:599–604. doi: 10.1038/nprot.2017.149. - DOI - PubMed
    1. Plass Mireya, Solana Jordi, Wolf F. Alexander, Ayoub Salah, Misios Aristotelis, Glažar Petar, Obermayer Benedikt, Theis Fabian J., Kocks Christine, Rajewsky Nikolaus. Cell type atlas and lineage tree of a whole complex animal by single-cell transcriptomics. Science. 2018;360(6391):eaaq1723. doi: 10.1126/science.aaq1723. - DOI - PubMed
    1. Cao J, Packer JS, Ramani V, Cusanovich DA, Huynh C, Daza R, et al. Comprehensive single-cell transcriptional profiling of a multicellular organism. Science. 2017;357:661–667. doi: 10.1126/science.aam8940. - DOI - PMC - PubMed
    1. Fincher Christopher T., Wurtzel Omri, de Hoog Thom, Kravarik Kellie M., Reddien Peter W. Cell type transcriptome atlas for the planarianSchmidtea mediterranea. Science. 2018;360(6391):eaaq1736. doi: 10.1126/science.aaq1736. - DOI - PMC - PubMed
    1. Han X, Wang R, Zhou Y, Fei L, Sun H, Lai S, et al. Mapping the Mouse Cell Atlas by Microwell-Seq. Cell. 2018;173:1307. doi: 10.1016/j.cell.2018.05.012. - DOI - PubMed

Publication types

MeSH terms

LinkOut - more resources