

Meta-analysis of preclinical studies of mesenchymal stromal cells to treat rheumatoid arthritis
- PMID: 31501076
- PMCID: PMC6796567
- DOI: 10.1016/j.ebiom.2019.08.073
Meta-analysis of preclinical studies of mesenchymal stromal cells to treat rheumatoid arthritis
Abstract
Background: This study aims to evaluate the quality of preclinical data, determine the effect sizes, and identify experimental measures that inform efficacy using mesenchymal stromal (or stem) cells (MSC) therapy in animal models of rheumatoid arthritis (RA).
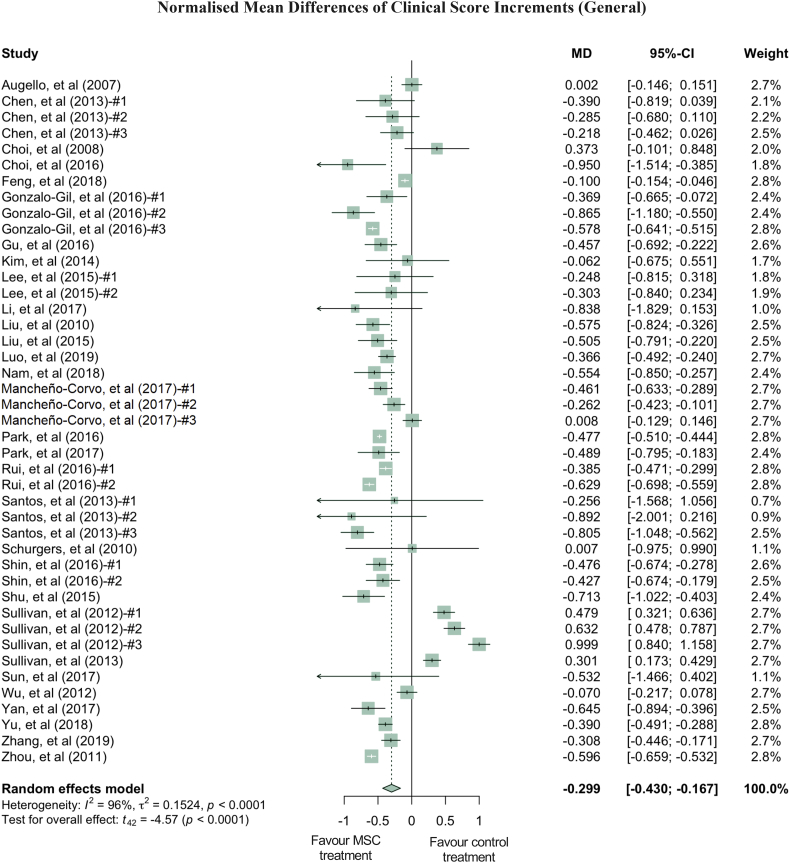
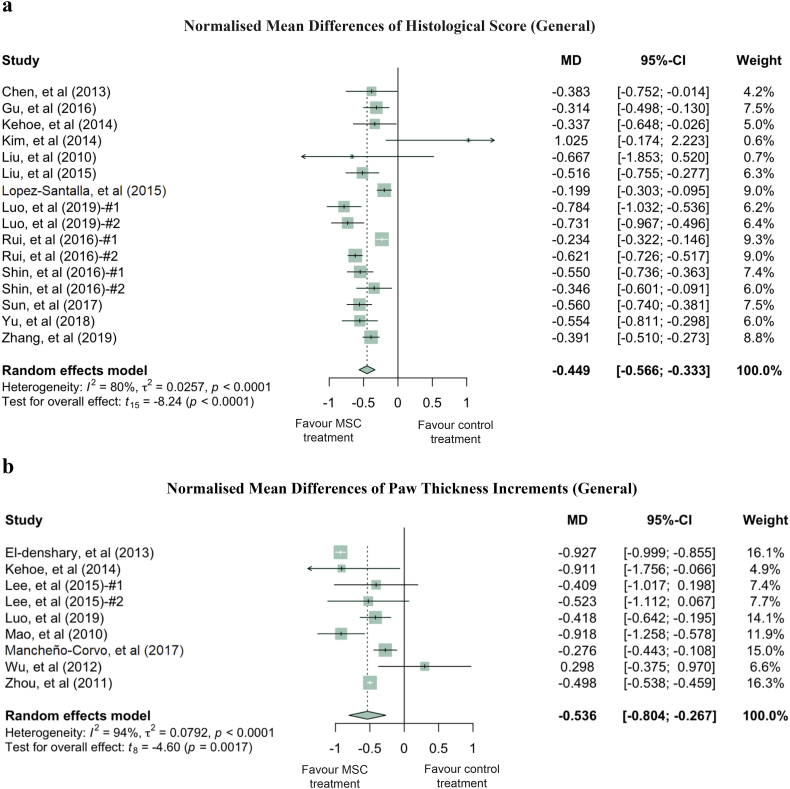
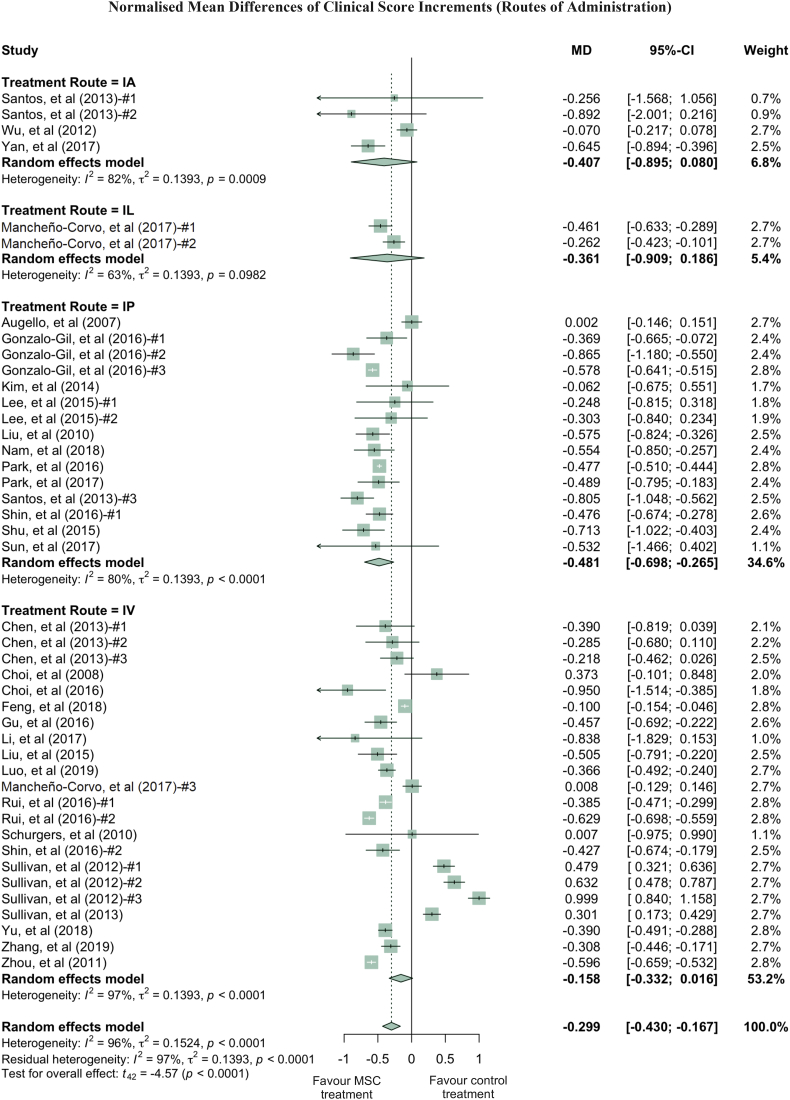
Methods: Literature searches were performed on MSC preclinical studies to treat RA. MSC treatment effect sizes were determined by the most commonly used outcome measures, including paw thickness, clinical score, and histological score.
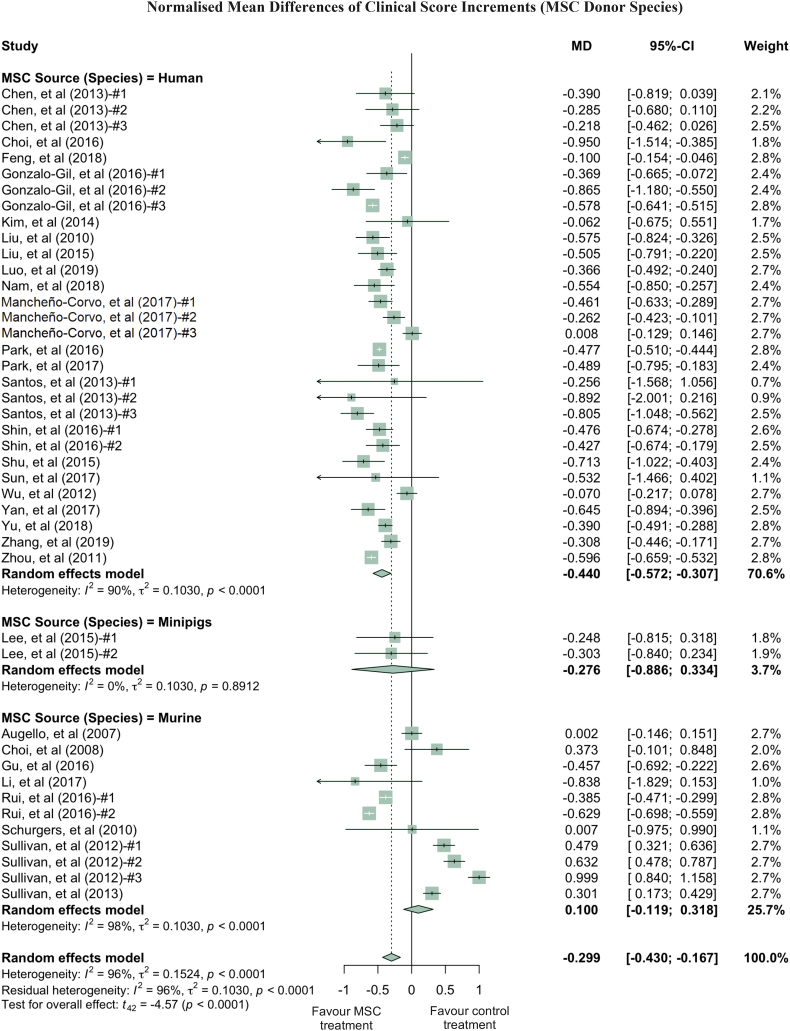
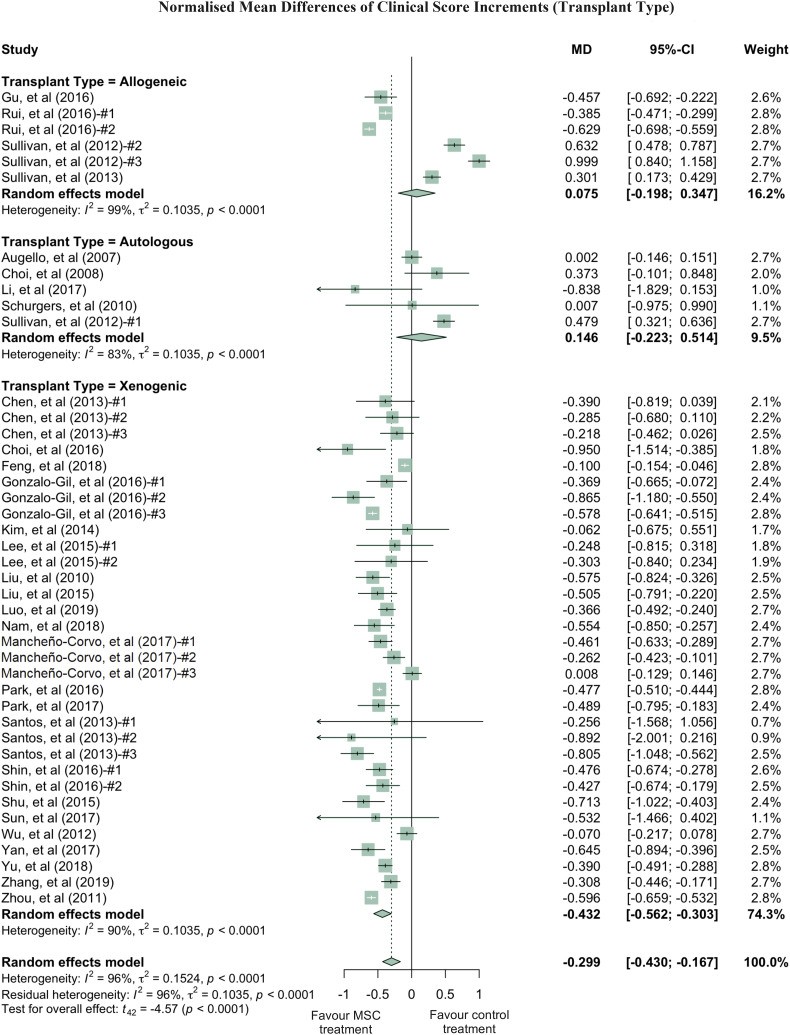
Findings: A total of 48 studies and 94 treatment arms were included, among which 42 studies and 79 treatment arms reported that MSC improved outcomes. The effect sizes of RA treatments using MSC, when compared to the controls, were: paw thickness was ameliorated by 53.6% (95% confidence interval (CI): 26.7% -80.4%), histological score was decreased by 44.9% (95% CI: 33.3% -56.6%), and clinical score was decreased by 29.9% (95% CI: 16.7% -43.0%). Specifically, our results indicated that human umbilical cord derived MSC led to large improvements of the clinical score (-42.1%) and histological score (-51.4%).
Interpretation: To the best of our knowledge, this meta-analysis is to quantitatively answer whether MSC represent a robust RA treatment in animal models. It suggests that in preclinical studies, MSC have consistently exhibited therapeutic benefits. The findings demonstrate a need for considering variations in different animal models and treatment protocols in future studies using MSC to treat RA in humans to maximise the therapeutic gains in the era of precision medicine.
Funds: NIH [1DP2CA195763], Baylx Inc.: BI-206512, NINDS/NIH Training Grant [Award# NS082174].
Keywords: Clinical trials; MSC; Mesenchymal stromal (or stem) cells; Meta-analysis; Pre-clinical study; Rheumatoid arthritis.
Copyright © 2019. Published by Elsevier B.V.
Conflict of interest statement
Dr. Weian Zhao reports grants from NIH, grant from Baylx Inc., during the conduct of the study. Dr. Zhao was a co-founder of and received personal fees from Baylx Inc. Dr. Zhao received grants and personal fees from Velox Biosystems Inc., as well as grants and personal fees from Amberstone Biosciences, outside the submitted work. Dr. Wenbin Liao is a co-founder and employee of Baylx Inc. aims to use UC-MSC to treat disease indications including RA. Henry P. Farhoodi reports fellowship from NINDS/NIH. Dr. Linan Liu, Chi W. Wong, Menglu Han and Henry P. Farhoodi report grant from Baylx Inc., during the conduct of the study. Dr. Guangyang Liu and Dr. Yongjun Liu have financial relationships with Beijng Beilai Biotechnology Corporation Ltd. that develops MSC-based products.
Figures

Similar articles
-
Mesenchymal stem/stromal cell-based therapy for the treatment of rheumatoid arthritis: An update on preclinical studies.EBioMedicine. 2021 Jul;69:103427. doi: 10.1016/j.ebiom.2021.103427. Epub 2021 Jun 20. EBioMedicine. 2021. PMID: 34161884 Free PMC article. Review.
-
The Secretome Derived From 3D-Cultured Umbilical Cord Tissue MSCs Counteracts Manifestations Typifying Rheumatoid Arthritis.Front Immunol. 2019 Feb 5;10:18. doi: 10.3389/fimmu.2019.00018. eCollection 2019. Front Immunol. 2019. PMID: 30804924 Free PMC article.
-
Therapeutic Potential of Mesenchymal Stromal Stem Cells in Rheumatoid Arthritis: a Systematic Review of In Vivo Studies.Stem Cell Rev Rep. 2020 Apr;16(2):276-287. doi: 10.1007/s12015-020-09954-z. Stem Cell Rev Rep. 2020. PMID: 31950339
-
Efficacy and Safety of Umbilical Cord Mesenchymal Stem Cell Therapy for Rheumatoid Arthritis Patients: A Prospective Phase I/II Study.Drug Des Devel Ther. 2019 Dec 19;13:4331-4340. doi: 10.2147/DDDT.S225613. eCollection 2019. Drug Des Devel Ther. 2019. PMID: 31908418 Free PMC article. Clinical Trial.
-
Intravenous Infusion of Umbilical Cord Blood-Derived Mesenchymal Stem Cells in Rheumatoid Arthritis: A Phase Ia Clinical Trial.Stem Cells Transl Med. 2018 Sep;7(9):636-642. doi: 10.1002/sctm.18-0031. Epub 2018 Aug 15. Stem Cells Transl Med. 2018. PMID: 30112846 Free PMC article. Clinical Trial.
Cited by
-
Rheumatoid Synovial Fluid and Acidic Extracellular pH Modulate the Immunomodulatory Activity of Urine-Derived Stem Cells.Int J Mol Sci. 2023 Nov 1;24(21):15856. doi: 10.3390/ijms242115856. Int J Mol Sci. 2023. PMID: 37958839 Free PMC article.
-
Clinical experience: Outcomes of mesenchymal stem cell transplantation in five stroke patients.Front Med (Lausanne). 2023 Jan 19;10:1051831. doi: 10.3389/fmed.2023.1051831. eCollection 2023. Front Med (Lausanne). 2023. PMID: 36744151 Free PMC article.
-
Mesenchymal stem cells and connective tissue diseases: From bench to bedside.J Transl Int Med. 2022 Nov 15;11(1):30-45. doi: 10.2478/jtim-2022-0028. eCollection 2023 Mar. J Transl Int Med. 2022. PMID: 37533846 Free PMC article.
-
Mesenchymal stem/stromal cell-based therapy for the treatment of rheumatoid arthritis: An update on preclinical studies.EBioMedicine. 2021 Jul;69:103427. doi: 10.1016/j.ebiom.2021.103427. Epub 2021 Jun 20. EBioMedicine. 2021. PMID: 34161884 Free PMC article. Review.
-
IFI44 is an immune evasion biomarker for SARS-CoV-2 and Staphylococcus aureus infection in patients with RA.Front Immunol. 2022 Sep 15;13:1013322. doi: 10.3389/fimmu.2022.1013322. eCollection 2022. Front Immunol. 2022. PMID: 36189314 Free PMC article.
References
-
- Hunt L., Emery P. Defining populations at risk of rheumatoid arthritis: the first steps to prevention. Nat Rev Rheumatol. 2014;10(9):521–530. - PubMed
-
- Smolen J.S., Aletaha D., Redlich K. The pathogenesis of rheumatoid arthritis: new insights from old clinical data? Nat Rev Rheumatol. 2012;8(4):235–243. - PubMed
-
- Choy E. Understanding the dynamics: pathways involved in the pathogenesis of rheumatoid arthritis. Rheumatology (Oxford) 2012;51(Suppl. 5):v3–v11. - PubMed
-
- Scott D.L., Wolfe F., Huizinga T.W. Rheumatoid arthritis. Lancet. 2010;376(9746):1094–1108. - PubMed
-
- Smolen J.S., Aletaha D. Rheumatoid arthritis therapy reappraisal: strategies, opportunities and challenges. Nat Rev Rheumatol. 2015;11(5):276–289. - PubMed
Publication types
MeSH terms
Grants and funding
LinkOut - more resources
Full Text Sources
Other Literature Sources
Medical
