. 2019 Oct 24;134(17):1415-1429.
doi: 10.1182/blood.2019001398.

Activated stromal cells transfer mitochondria to rescue acute lymphoblastic leukemia cells from oxidative stress

Affiliations

Activated stromal cells transfer mitochondria to rescue acute lymphoblastic leukemia cells from oxidative stress

Richard Burt et al. Blood. .

Abstract

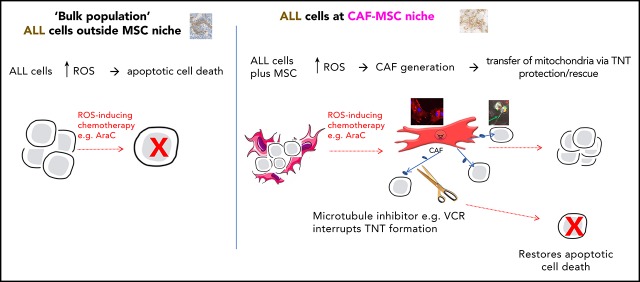
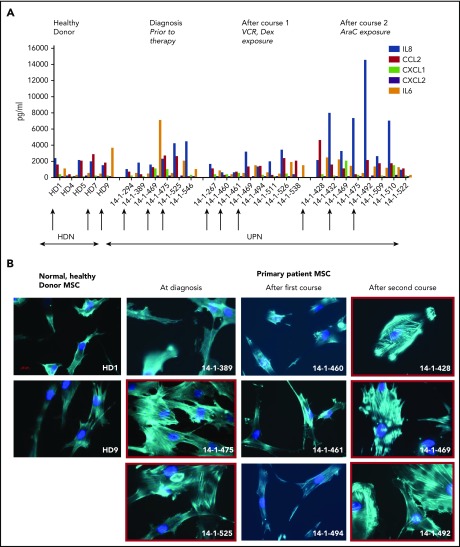
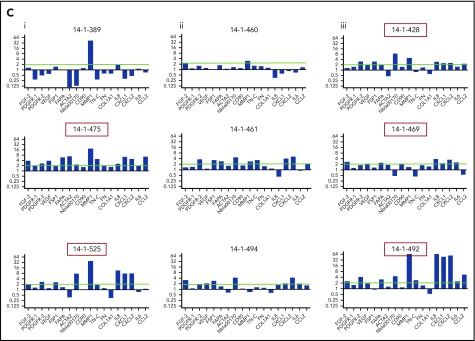
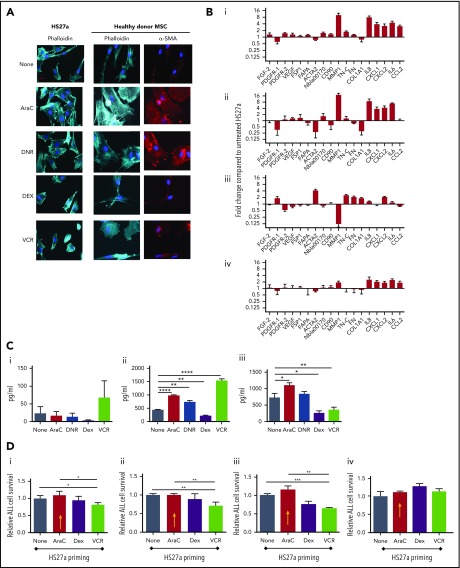
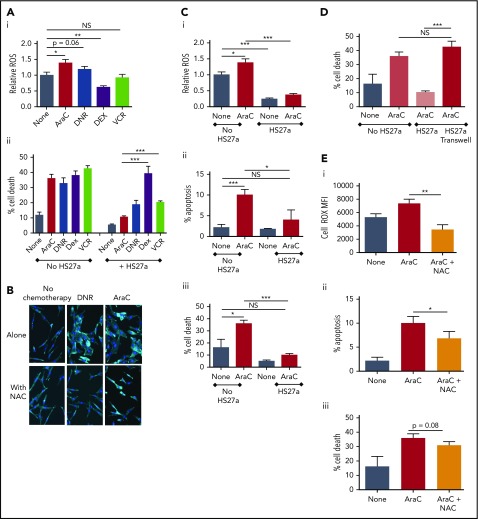
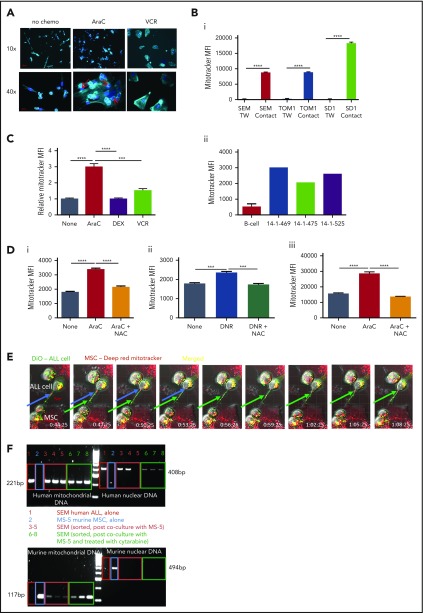
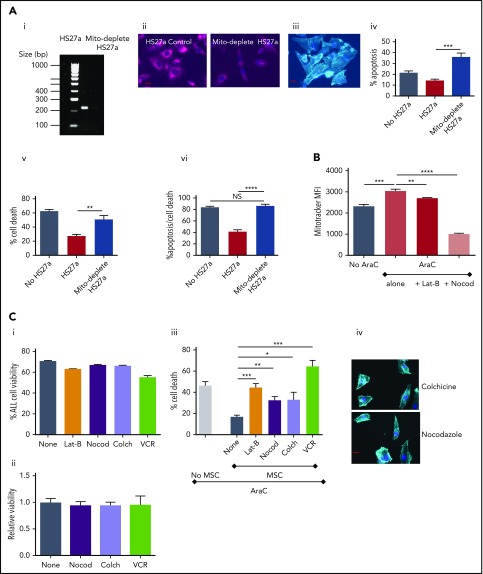
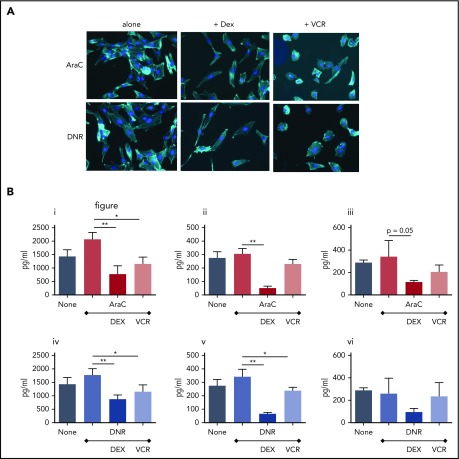
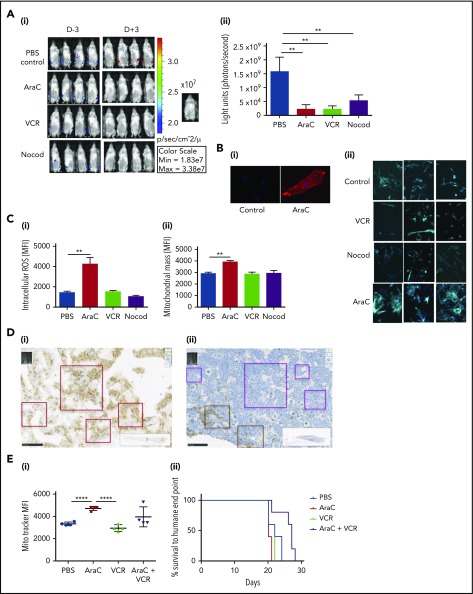
We investigated and modeled the mesenchymal stromal cell (MSC) niche in adult acute lymphoblastic leukemia (ALL). We used gene expression profiling, cytokine/chemokine quantification, flow cytometry, and a variety of imaging techniques to show that MSCs, directly isolated from the primary bone marrow specimens of patients with ALL, frequently adopted an activated, cancer-associated fibroblast phenotype. Normal, primary human MSCs and the MSC cell line HS27a both were activated de novo, when exposed to the reactive oxygen species (ROS)-inducing chemotherapy agents cytarabine (AraC) and daunorubicin (DNR), a phenomenon blocked by the antioxidant N-acetyl cysteine. Chemotherapy-activated HS27a cells were functionally evaluated in a coculture model with ALL targets. Activated MSCs prevented therapy-induced apoptosis and death in ALL targets, via mitochondrial transfer through tunneling nanotubes (TNTs). Reduction of mitochondrial transfer by selective mitochondrial depletion or interference with TNT formation by microtubule inhibitors, such as vincristine (VCR), prevented the "rescue" function of activated MSCs. Corticosteroids, also a mainstay of ALL therapy, prevented the activation of MSCs. We also demonstrated that AraC (but not VCR) induced activation of MSCs, mitochondrial transfer, and mitochondrial mass increase in a murine NSG model of disseminated SEM cell-derived ALL, wherein CD19+ cells closely associated with nestin+ MSCs after AraC, but not in the other conditions. Our data propose a readily clinically exploitable mechanism for improving treatment of ALL, in which traditional ROS-inducing chemotherapies are often ineffective at eradicating residual disease, despite efficiently killing the bulk population.


Conflict of interest statement

Conflict-of-interest disclosure: The authors declare no competing financial interests.

Figures

None
Graphical abstract
Figure 1.
Figure 1.
Activated fibroblasts are common in primary samples from patients with de novo ALL who are undergoing induction chemotherapy. (A) Cytokines and chemokines secreted by MSCs isolated from the normal healthy donor bone marrow or primary patient ALL specimens at diagnosis and after the first and second courses of chemotherapy. IL8 (blue), CCL2 (red), CXCL1 (green), CXCL2 (purple), and IL6 (orange), all in picograms per milliliter, are shown on the y-axis. The x-axis shows each sample denoted by UKALL14 trial patient number (UPN) or healthy donor number (HDN). Arrows below the x-axis indicate the specimens that were subsequently evaluated in more detail. (B) Photomicrographs (original magnification ×40), showing phalloidin and DAPI staining of MSCs isolated from primary patient ALL samples indicated by UPN or HDN. (C) Gene expression profile showing fold upregulation (y-axis) of 18 selected genes in primary patient MSCs (UPN indicated above the panel) at diagnosis (i) and after the first (ii) and second (iii) courses of chemotherapy, compared with the mean baseline of 3 normal healthy donor MSCs, isolated from patients with primary ALL. Red box around UPN indicates specimen with morphological changes. Gene names are shown on the x-axis. A blue line is drawn at twofold upregulation, which is considered significant.
Figure 1.
Figure 1.
Activated fibroblasts are common in primary samples from patients with de novo ALL who are undergoing induction chemotherapy. (A) Cytokines and chemokines secreted by MSCs isolated from the normal healthy donor bone marrow or primary patient ALL specimens at diagnosis and after the first and second courses of chemotherapy. IL8 (blue), CCL2 (red), CXCL1 (green), CXCL2 (purple), and IL6 (orange), all in picograms per milliliter, are shown on the y-axis. The x-axis shows each sample denoted by UKALL14 trial patient number (UPN) or healthy donor number (HDN). Arrows below the x-axis indicate the specimens that were subsequently evaluated in more detail. (B) Photomicrographs (original magnification ×40), showing phalloidin and DAPI staining of MSCs isolated from primary patient ALL samples indicated by UPN or HDN. (C) Gene expression profile showing fold upregulation (y-axis) of 18 selected genes in primary patient MSCs (UPN indicated above the panel) at diagnosis (i) and after the first (ii) and second (iii) courses of chemotherapy, compared with the mean baseline of 3 normal healthy donor MSCs, isolated from patients with primary ALL. Red box around UPN indicates specimen with morphological changes. Gene names are shown on the x-axis. A blue line is drawn at twofold upregulation, which is considered significant.
Figure 2.
Figure 2.
AraC and DNR activate MSCs, de novo which abrogates B-ALL target cell responses to chemotherapy agents in coculture. (A) Phalloidin, DAPI, or αSMA staining (original magnification ×40) of HS27a cells or healthy donor MSCs: at baseline or after exposure to the chemotherapy agents indicated. (B) Gene expression panel showing fold upregulation (compared with untreated) in HS27a cells after exposure to the chemotherapy agents AraC (i), DNR (ii), DEX (iii), and VCR (iv). (C) Cytokine bead assays for IL6 (i), IL8 (ii), and CCL2 (iii) (picograms per milliliter, y-axis) following exposure of HS27a cells to the chemotherapy agents indicated on the x-axis. All statistically significant comparisons (by unpaired Student t test) are as depicted: IL8, none vs AraC, P < .0001; IL8, none vs DNR, P = .002; IL8, none vs DEX, P = .001; and IL8, none vs VCR, P < .0001. CCL2, none vs AraC, P = .0169; CCL2, none vs DEX, P = .0166; and CCL2, none vs VCR, P = .0065. (D) MTS assays showing relative viability of SEM cells (y-axis) after treatment with AraC (i), DEX (ii), and VCR (iii) for 48 hours, after coculture with HS27a cells previously primed by chemotherapy before the treatment denoted on the x-axis. Data are shown relative to unprimed HS27a cells, set at 1. AraC-primed HS27a cells are highlighted throughout with a yellow arrow. All statistically significant comparisons (by unpaired Student t test) are as depicted: no pretreatment vs VCR, P = .041, and AraC vs VCR, P = .022 (i). No pretreatment vs VCR, P = .0087, and AraC vs VCR, P = .0087 (ii). No pretreatment vs VCR, P = .0006, AraC vs VCR, P = .0017 (iii). (iv) MTS assay showing relative viability of SEM cells (y-axis) after Transwell culture with primed HS27a cells as denoted on the x-axis. Data are relative to unprimed HS27a, set at 1. There are no statistically significant differences. All data are the mean ± SE of 3 independent experiments. *.01 < P ≤ .05; **.001 < P ≤ .01; ***.0001 < P ≤ .001; ****P ≤ .0001.
Figure 3.
Figure 3.
ROS promote CAF formation and MSC-mediated chemoprotection. (A) ROS levels relative to the untreated SEM baseline (1.0), y-axis, after exposure to chemotherapy agents indicated on the x-axis. Percentage cell death (DAPI+, y-axis) of SEM cells exposed to the chemotherapy agents indicated either in monoculture or during coculture with HS27a cells, all shown on the x-axis. Bars show the mean ± SE of 3 independent experiments. All statistically significant comparisons (by unpaired Student t test) are as depicted: (i) ROS level, none vs AraC, P = .0115; none vs DNR, P = .06, and none vs DEX, P = .0035. (ii) Percentage cell death, HS27a AraC vs DEX, P = .0007, and HS27a AraC vs VCR, P = .0003. (B) Phalloidin/DAPI staining of HS27a MSCs alone or exposed to DNR or AraC, with or without 5 mM NAC (original magnification ×20). (Ci) CellROX ROS assay showing the mitochondrial mass (y-axis) of SEM cells in monoculture, baseline set at 1.0, or after coculture with HS27a cells, with or without AraC (x-axis). Statistically significant comparisons (by unpaired Student t test) are as depicted: no HS27a none vs AraC, P = .0115; no HS27a vs HS27a none, P = .0002; and no HS27a+AraC vs HS27a+AraC, P = .0001. (ii) Percentage apoptosis (annexin V+, DAPI, y-axis) of SEM cells in monoculture, baseline set at 1.0, or after coculture with HS27a cells, with or without AraC (x-axis). All statistically significant comparisons (by unpaired Student t test) are as depicted: no HS27a none vs AraC, P = .0009, and no HS27a+AraC vs HS27a+AraC, P = .0189. (iii) Cell death (DAPI+, y-axis) of SEM cells in monoculture, baseline set at 1.0 or after coculture with HS27a cells, with or without AraC. All statistically significant comparisons (by unpaired Student t test) are as depicted: no HS27a none vs AraC, P = .0102, and no HS27a+AraC vs HS27a+AraC, P = .0001. (D) Cell death (DAPI+, y-axis) of SEM cells in monoculture, with or without AraC, compared with SEM cocultured in contact with HS27a cells or in a Transwell, both with AraC (x-axis). All statistically significant comparisons (by unpaired Student t test) are as depicted: HS27a AraC vs HS27a Transwell+AraC, P = .0002. (E) ROS levels (i), apoptosis (ii), and cell death (iii) (y-axis), with no treatment, AraC treatment, or AraC treatment+NAC (x-axis). Bars show the mean ± SE of 3 independent experiments. Significant reductions in ROS (P = .002) and apoptosis (P = .0479) and a nonsignificant reduction in cell death (P = .08) by unpaired Student t test are shown. *.01 < P ≤ .05; **.001 < P ≤ .01; ***.0001 < P ≤ .001.
Figure 4.
Figure 4.
AraC and DNR stimulate mitochondrial transfer from healthy donor or HS27a MSCs to ALL cells via TNTs. (A) Phalloidin and DAPI staining of SEM+HD MSC coculture incubated with AraC or VCR at original magnifications ×10 and ×40. Red arrows indicate SEM cells (round with prominent nuclei) in physical contact with MSCs. (Bi) Mitochondrial transfer by MitoTracker assay (mean fluorescence intensity [MFI], y-axis), from HS27a to SEM, TOM1, and SD1 ALL cells in contact or in a Transwell (x-axis). All data are the mean ± SE of 3 independent experiments. All statistically significant comparisons (by unpaired Student t test) are as depicted: SEM HS27a vs HS27a Transwell, P < .0001; TOM1 HS27a vs Transwell, P < .0001; and SD1 HS27a vs Transwell, P < .0001. (ii) Mitochondrial transfer by MitoTracker assay (MFI, y-axis), from healthy donor MSC to healthy donor B-cells (3 independent experiments) or patient ALL cells identified by UKALL14 trial number (UPN; x-axis). (C) Mitochondrial transfer by MitoTracker assay (MFI, y-axis) from HS27a to SEM after coculture and either no treatment or treatment with AraC, VCR, or DEX. All statistically significant comparisons (by unpaired Student t test) are as depicted: no treatment vs AraC, P < .0001; AraC vs DEX, P < .0001; and AraC vs VCR, P = .0003. (Di) Mitochondrial transfer by MitoTracker assay (MFI, y-axis) of SEM cells in coculture with HS27a MSCs after no treatment, AraC, or 5 mM AraC+NAC. All statistically significant comparisons (by unpaired Student t test) are as depicted: no treatment vs AraC, P < .0001, and AraC vs AraC+NAC, P < .0001. (ii) Mitochondrial mass by MitoTracker assay (MFI, y-axis) of SEM cells in coculture with HS27a MSCs after no treatment, DNR or 5 mM DNR+NAC. All statistically significant comparisons (by unpaired Student t test) are as depicted: no treatment vs DNR, P = .0002, and DNR vs DNR+NAC, P = .0002. (iii) Mitochondrial mass by MitoTracker assay of REH cells in coculture with HS27a MSCs after no treatment, AraC, or 5 mM AraC+NAC. All statistically significant comparisons (by unpaired Student t test) are as depicted: no treatment vs AraC, P < .0001, and AraC vs AraC+NAC, P < .0001. (E) Live-cell confocal imaging of HS27a cells, stained deep red with MitoTracker in coculture with SEM ALL cells stained with DiO. Images were taken at the time points indicated (3 minutes apart). The blue and green arrows each indicate the progression of 2 individual mitochondria along a TNT. (F) Agarose gel images showing PCR products from human nuclear and mitochondrial DNA and murine nuclear and mitochondrial DNA, as indicated in each quadrant. Lane 1, MS-5 murine MSCs; lane 2, SEM cells; lanes 3 to 5, SEM cells sorted after coculture with MS-5; lanes 6 to 8, SEM cells sorted after AraC-treated coculture with MS-5. Human nuclear DNA PCR in lane 5 failed. ***.0001 < P ≤ .001; ****P ≤ .0001.
Figure 5.
Figure 5.
Microtubule inhibition blocks mitochondrial transfer and releases ALL cells from ROS-induced, MSC-mediated protection. (Ai) Agarose gel with PCR products from amplification of HS27a mitochondrial DNA, with or without mitochondrial depletion. (ii) Fluorescence microscopy imaging of MitoTracker dye in HS27a cells, with or without mitochondrial depletion. (iii) Imaging (original magnification ×40) of mitochondrially depleted (mito-depleted) HS27a cells in culture with SEM cells after phalloidin and DAPI staining. (iv) Percentage of apoptosis (annexin V+, DAPI, y-axis) of SEM cells treated with AraC, SEM cells cocultured with HS27a treated with AraC, or SEM cocultured with HS27a mito-depleted cells treated with AraC (x-axis). All statistically significant comparisons (by unpaired Student t test) are as depicted: HS27a vs mito-depleted HS27a cells, P = .0008. (v) Percentage cell death (DAPI+, y-axis) of SEM cells treated with AraC, cocultured with HS27a treated with AraC, or cocultured with HS27a mito-depleted cells treated with AraC (x-axis). All statistically significant comparisons (by unpaired Student t test) are as depicted: MH27a vs mito-depleted HS27a, P = .0043. (vi) Percentage cell death or apoptosis (DAPI+ or annexin V+/DAPI, y-axis) of SEM cells+AraC, SEM cells cocultured with HS27a cells+AraC, or SEM cells cocultured with mito-depleted HS27a+AraC (x-axis). All data are the mean ± SE of results in 3 independent experiments. All statistically significant comparisons (by unpaired Student t test) are as depicted: MH27a vs mito-depleted HS27a cells, P < .0001. (B) Mitochondrial transfer from HS27a to SEM cells after microtubule-damaging blockade. (MitoTracker MFI, y-axis). The baseline condition is coculture with no added agents; all other conditions are AraC treated, either alone or with latrunculin-B (lat-B) and nocodazole (nocod) (x-axis). All statistically significant comparisons (by unpaired Student t test) are as depicted: none vs AraC, P = .0005; AraC vs AraC+lat-B, P = .0028; and AraC vs AraC+nocod, P < .0001. (Ci) Percentage viability (y-axis) after treatment of SEM ALL cells with the agents indicated (x-axis). (ii) Relative viability (y-axis) after treatment of HS27a cells with the agents indicated (x-axis). (iii) Percentage cell death (y-axis) after AraC-treatment of SEM, either in monoculture or coculture with HS27a cells, alone or with lat-B+nocod, colchicine, or VCR added (x-axis). All data are the mean ± SE of 3 independent experiments. All statistically significant comparisons (by unpaired Student t test) are as depicted: MSC none vs lat-B, P = .0004; MSC none vs nocod, P = .0018; MSC none vs colchicine, P = .0167; and MSC none vs VCR, P = .0002. (iv) Phalloidin and DAPI staining of HS27a (original magnification ×40) after exposure to nocodazole or colchicine. *.01 < P ≤ .05; **.001 < P ≤ .01; ***.0001 < P ≤ .001; ****P ≤ .0001.
Figure 6.
Figure 6.
Combining VCR or Dex with AraC or DNR prevents HS27a MSCs from developing the characteristic pathology and cytokine secretion patterns of CAF. (A) Phalloidin/DAPI staining of AraC or DNR-treated HS27a cells, either alone or with VCR or DEX (original magnification ×20). (B) Cytokines and chemokines IL8 (i,iv), IL6 (ii,v), and CCL2 (iii,vi) secreted by HS27a after AraC (i-iii) or DNR (iv-vi) treatment, alone or with DEX or VCR. All statistically significant comparisons (by unpaired Student t test) are as depicted: IL8 AraC vs AraC+DEX, P = .0049; AraC vs AraC+VCR, P = .0112; IL6 AraC vs AraC+DEX, P = .0005; CCL2 AraC vs AraC+DEX, P = .05; IL8 DNR vs DNR+DEX, P = .0053; DNR vs DNR+VCR, P = .0364; IL6 DNR vs DNR+DEX, P = .0011; and DNR vs DNR+VCR, P = .04. *.01 < P ≤ .05; **.001 < P ≤ .01.
Figure 7.
Figure 7.
AraC, but not vincristine or nocodazole, increases ROS and mitochondrial transfer from MSCs to ALL cells in a murine xenograft model of ALL and stimulates formation of a nestin+niche. (A) Live imaging of tumor burden at days −3 and +3, with respect to the treatments given. (i) Images with color scale bar and control mice are shown. (ii) Quantification of the luciferase expression with region of intensity units on the y-axis and experimental conditions on the x-axis. PBS vs AraC, P = .0026; PBS vs VCR, P = .0023 and for PBS vs nocodazole, P = .0098. (Bi) αSMA staining of MSCs isolated and expanded from 1 control and 1 AraC-treated mouse (original magnification ×40). (ii) Phalloidin/DAPI staining of MSCs isolated and expanded from 3 control, AraC, VCR, and nocodazole-treated mice (original magnification ×20). ROS (mean fluorescence intensity [MFI], y-axis) (Ci) and mitochondrial mass (green MitoTracker MFI, y-axis) (ii) after treatment of mice bearing SEM xenografts with the agents indicated (x-axis). Cells were harvested from mice at day +3 after treatment with control, AraC, VCR, or nocodazole. All statistically significant comparisons (by unpaired Student t test) are as depicted. (i) ROS: PBS vs Ara-C, P = .0053, and (ii) MitoTacker mass: PBS vs AraC, P = .0014. (D) Immunohistochemistry of sections of representative whole femora from AraC- and VCR-treated mice. Femora are dual stained with human CD19 (brown) and murine nestin (pink). (i) In the AraC example, CD19+ cells are seen closely associating with a nestin+ niche, as indicated by the red boxes. (ii) In the VCR example, CD19+ cells (brown boxes) are not associated with nestin+ cells (pink boxes). (Ei) Mitochondrial mass (green MitoTracker MFI, y-axis) after treatment of mice bearing SEM xenografts with the agents indicated. SEM cells were harvested from mice treated with PBS, AraC, VCR, or AraC+VCR at day +3 after treatment with control, AraC, VCR, or AraC+VCR. (ii) Kaplan-Meier survival curves (n = 5 mice per group) for mice treated with PBS (blue), AraC (red), VCR (green), and AraC+VCR (purple). All statistically significant comparisons (by unpaired Student t test) are as depicted: PBS vs AraC, P < .0001, and AraC vs VCR, P < .0001. Survival of AraC+VCR-treated mice was significantly greater than that of each of the other 3 groups, by Mantel-Cox test: PBS vs AraC+VCR, P = .0253; AraC vs AraC+VCR, P = .0080; and VCR vs AraC+VCR .0305. **.001 < P ≤ .01; ****P ≤ .0001.

References

    1. Bruggemann M, Schrauder A, Raff T, et al. . Standardized MRD quantification in European ALL trials: proceedings of the Second International Symposium on MRD assessment in Kiel, Germany, 18-September 20, 2008. Leukemia. 2010;24(3):521-535. - PubMed
    1. van Delft FW, Horsley S, Colman S, et al. . Clonal origins of relapse in ETV6-RUNX1 acute lymphoblastic leukemia. Blood. 2011;117(23):6247-6254. - PubMed
    1. Duan CW, Shi J, Chen J, et al. . Leukemia propagating cells rebuild an evolving niche in response to therapy. Cancer Cell. 2014;25(6):778-793. - PubMed
    1. Ebinger S, Özdemir EZ, Ziegenhain C, et al. . Characterization of Rare, Dormant, and Therapy-Resistant Cells in Acute Lymphoblastic Leukemia. Cancer Cell. 2016;30(6):849-862. - PMC - PubMed
    1. Hawkins ED, Duarte D, Akinduro O, et al. . T-cell acute leukaemia exhibits dynamic interactions with bone marrow microenvironments. Nature. 2016;538(7626):518-522. - PMC - PubMed

Publication types

MeSH terms