. 2019 Sep 24;116(39):19398-19408.
doi: 10.1073/pnas.1904159116. Epub 2019 Sep 9.

Quantifying the contribution of sequence variants with regulatory and evolutionary significance to 34 bovine complex traits

Affiliations

Quantifying the contribution of sequence variants with regulatory and evolutionary significance to 34 bovine complex traits

Ruidong Xiang et al. Proc Natl Acad Sci U S A. .

Abstract

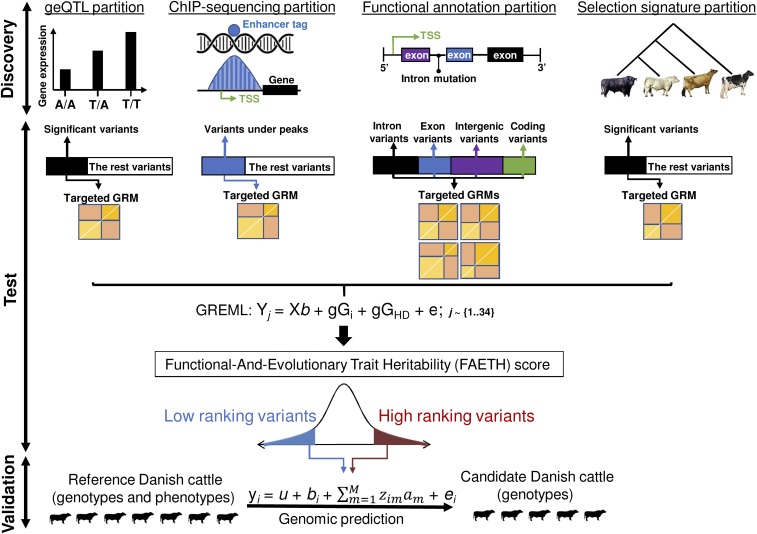
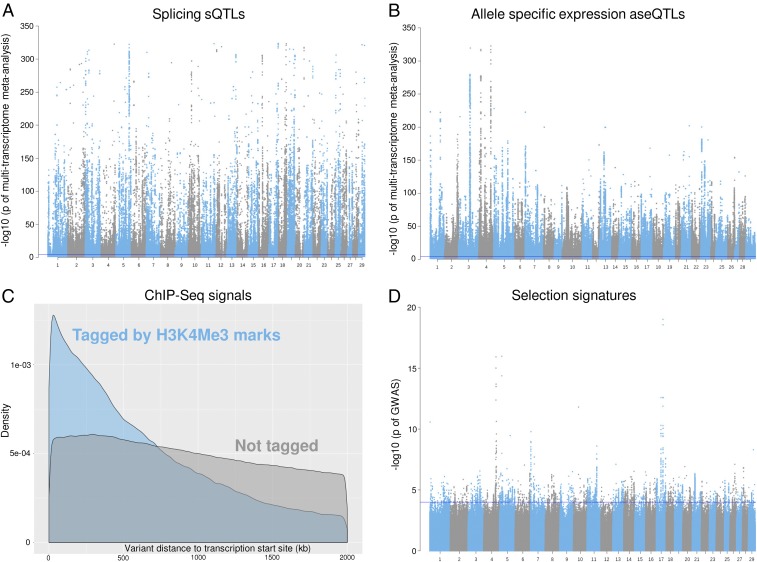
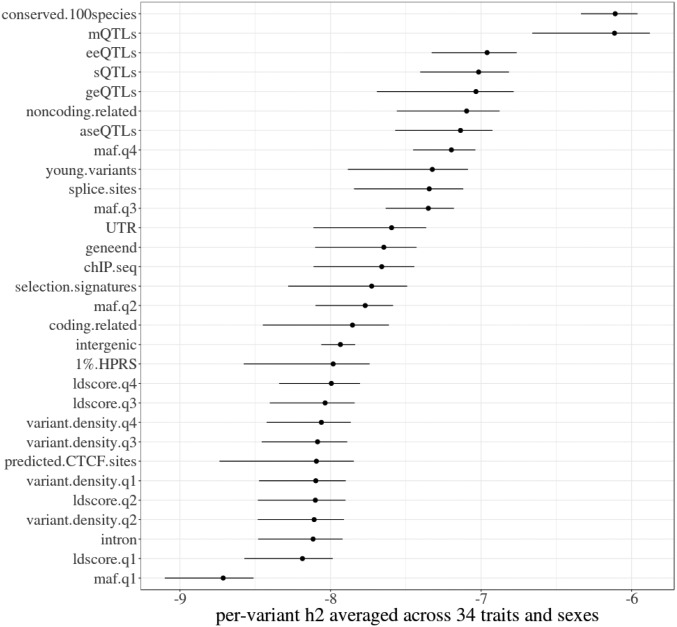
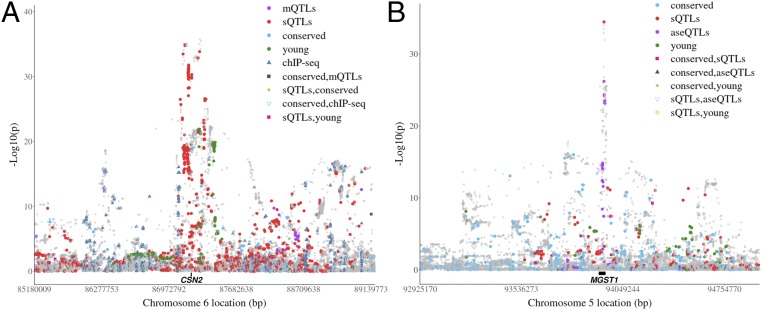
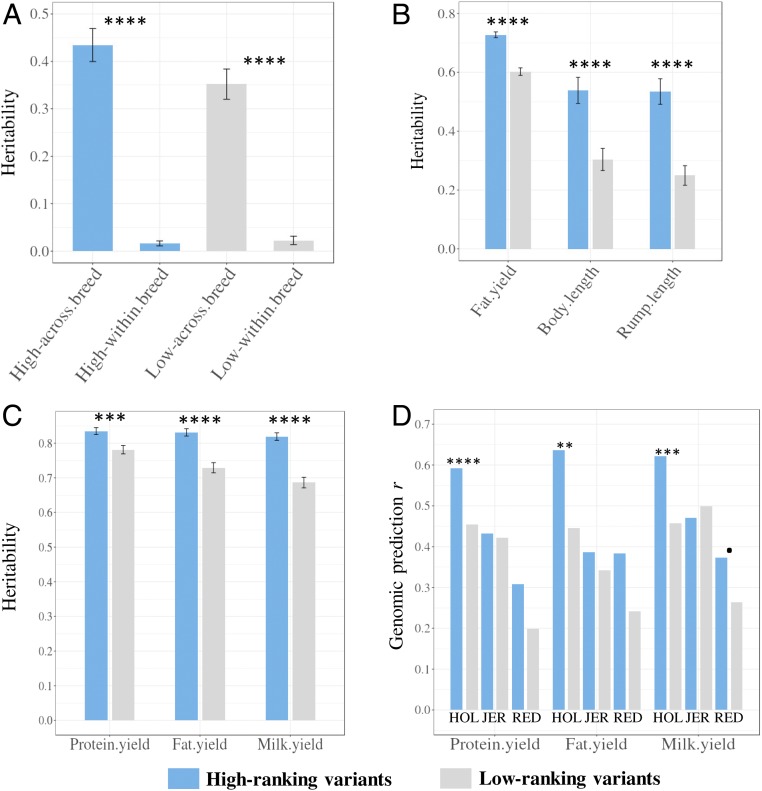
Many genome variants shaping mammalian phenotype are hypothesized to regulate gene transcription and/or to be under selection. However, most of the evidence to support this hypothesis comes from human studies. Systematic evidence for regulatory and evolutionary signals contributing to complex traits in a different mammalian model is needed. Sequence variants associated with gene expression (expression quantitative trait loci [eQTLs]) and concentration of metabolites (metabolic quantitative trait loci [mQTLs]) and under histone-modification marks in several tissues were discovered from multiomics data of over 400 cattle. Variants under selection and evolutionary constraint were identified using genome databases of multiple species. These analyses defined 30 sets of variants, and for each set, we estimated the genetic variance the set explained across 34 complex traits in 11,923 bulls and 32,347 cows with 17,669,372 imputed variants. The per-variant trait heritability of these sets across traits was highly consistent (r > 0.94) between bulls and cows. Based on the per-variant heritability, conserved sites across 100 vertebrate species and mQTLs ranked the highest, followed by eQTLs, young variants, those under histone-modification marks, and selection signatures. From these results, we defined a Functional-And-Evolutionary Trait Heritability (FAETH) score indicating the functionality and predicted heritability of each variant. In additional 7,551 cattle, the high FAETH-ranking variants had significantly increased genetic variances and genomic prediction accuracies in 3 production traits compared to the low FAETH-ranking variants. The FAETH framework combines the information of gene regulation, evolution, and trait heritability to rank variants, and the publicly available FAETH data provide a set of biological priors for cattle genomic selection worldwide.

Keywords: animal breeding; cattle; evolution; gene regulation; quantitative traits.


Conflict of interest statement

The authors declare no conflict of interest.

Figures

Fig. 1.
Fig. 1.
Overview of the analysis. The discovery analysis involved the selection of variants from functional and evolutionary datasets; this figure shows examples of some of the datasets used. In the test analysis, each of the variant sets was used to make GRMs. Then, each one was analyzed in the GREML (gGi), together with the high-density SNP chip GRM (gGHD) for each of the 34 traits (Yj, j={1..34}). Once the heritability, hset2, of each gGi was calculated, it was averaged across traits and adjusted for the number of variants used to build the gGi to calculate the per-variant hset2¯. The FAETH scoring of each variant was derived based on their memberships to differentially partitioned sets and the per-variant hset2¯. In the validation analysis, variants with high and low FAETH ranking were tested in a Danish cattle dataset for GREML and genomic prediction of 3 production traits. The Australian test dataset contained 9,739 bulls and 22,899 cows of Holstein breed, 2,059 bulls and 6,174 cows of Jersey, 2,850 cows of mixed breeds, and 125 bulls and 424 cows of Australian Red. The Danish reference set contained 4,911 Holstein, 957 Jersey, and 745 Danish Red bulls, and the Danish validation population contained 500 Holstein, 517 Jersey, and 192 Danish Red bulls.
Fig. 2.
Fig. 2.
Examples of regulatory and evolutionary signals from the discovery analysis. (A) A Manhattan plot of the metaanalysis of sQTLs from white blood and milk cells and liver and muscle tissues. (B) A Manhattan plot of the metaanalysis of aseQTLs in the white blood cells. (C) A distribution density plot of variants tagged by H3K4Me3 ChIP-seq mark from mammary gland within 2 Mb of gene transcription start site. (D) Artificial selection signatures between 8 dairy and 7 beef cattle breeds with the linear mixed-model approach using the 1000 Bull Genome database. The blue line indicates −log10(P value) = 4.
Fig. 3.
Fig. 3.
The proportion of genetic variances explained by sets of variants selected from functional and evolutionary categories. The ranking of variant sets based on the log10 scale of per-variant hset2¯, averaged across bulls (left error bar) and cows (right error bar).
Fig. 4.
Fig. 4.
Examples of top-ranked variant sets in important bovine trait QTL. (A) Manhattan plot of the metaanalysis of GWAS of 34 traits in the ±2 Mb region surrounding the beta casein (CSN2) gene, a major QTL for milk protein yield. (B) Manhattan plot of the metaanalysis of GWAS of 34 traits in the ±1 Mb region of the microsomal GST 1 (MGST1) gene, a major QTL for milk fat yield. The dots are colored based on their set memberships. The black bar between the gray dots and the X-axis indicates the gene locations.
Fig. 5.
Fig. 5.
Further tests of the variant FAETH score. (A) The heritability of high and low FAETH ranking variants for the multibreed GRM and the within-breed GRM (2 GRMs fitted together) estimated across 34 traits in the Australian data. The error bars are the SE of heritability calculated across 34 traits. (B) The heritability of high and low FAETH ranking variants for 3 additional traits to the 34 traits in the Australian data used to calculate the FAETH score. (C) The multibreed heritability of high and low FAETH variants for 3 production traits in Danish data. The error bars are the SEs of the heritability of each GREML analysis. (D) Prediction accuracy of gBLUP of 3 production traits in Danish data using high and low FAETH variants (averaged between bulls and cows). The genomic predictors were trained in multiple breeds and predicted into single breeds (HOL, Holstein; JER, Jersey). P values of significant difference based on Z-score test: P < 0.1; **P < 0.01; ***P < 0.001; ****P < 0.0001. Note that for the prediction accuracy r, the significance of difference was based on the sample sizes of the Danish candidate subset where there were 500 Holstein, 517 Jersey, and 192 Danish Red (Materials and Methods).

References

    1. Visscher P. M., et al. , 10 years of GWAS discovery: Biology, function, and translation. Am. J. Hum. Genet. 101, 5–22 (2017). - PMC - PubMed
    1. Nielsen J. B., et al. , Biobank-driven genomic discovery yields new insight into atrial fibrillation biology. Nat. Genet. 50, 1234–1239 (2018). - PMC - PubMed
    1. Food and Agriculture Organisation of the United Nations, FAOSTAT http://www.fao.org/faostat/en/#search/Cattle. Accessed 31 August 2018.
    1. Taylor J. F., Taylor K. H., Decker J. E., Holsteins are the genomic selection poster cows. Proc. Natl. Acad. Sci. U.S.A. 113, 7690–7692 (2016). - PMC - PubMed
    1. Bouwman A. C., et al. , Meta-analysis of genome-wide association studies for cattle stature identifies common genes that regulate body size in mammals. Nat. Genet. 50, 362–367 (2018). - PubMed

Publication types

LinkOut - more resources