. 2019 Sep 24;116(39):19490-19499.
doi: 10.1073/pnas.1912459116. Epub 2019 Sep 9.

Spatial transcriptome profiling by MERFISH reveals subcellular RNA compartmentalization and cell cycle-dependent gene expression

Affiliations

Spatial transcriptome profiling by MERFISH reveals subcellular RNA compartmentalization and cell cycle-dependent gene expression

Chenglong Xia et al. Proc Natl Acad Sci U S A. .

Abstract

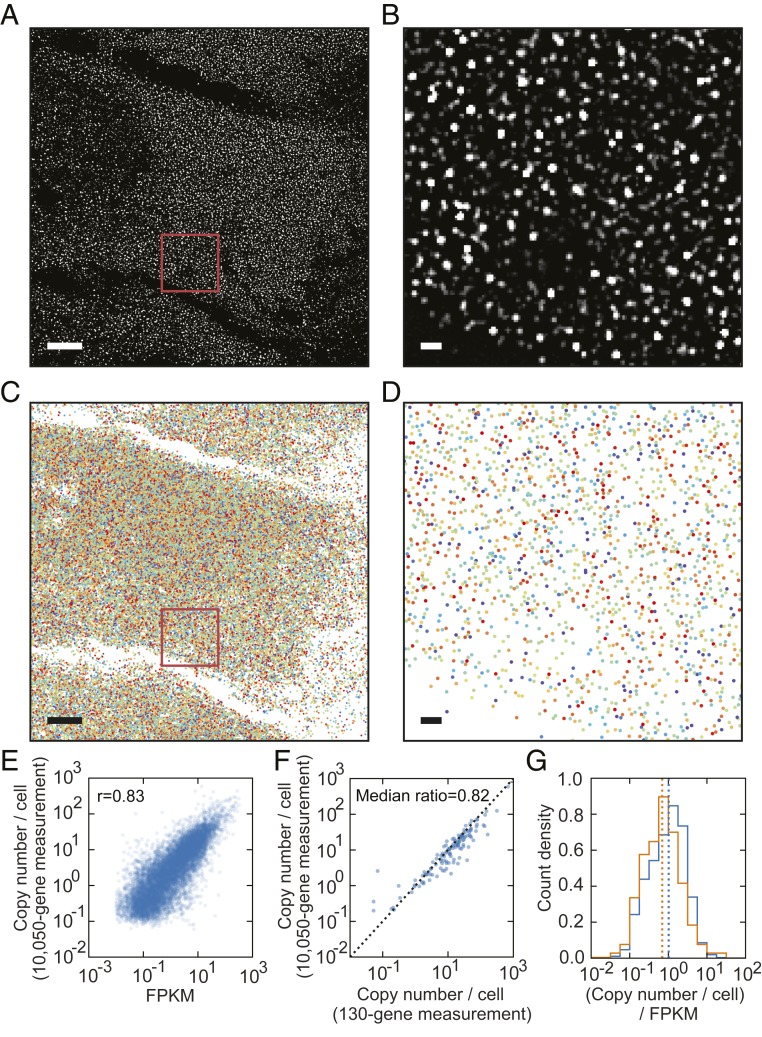
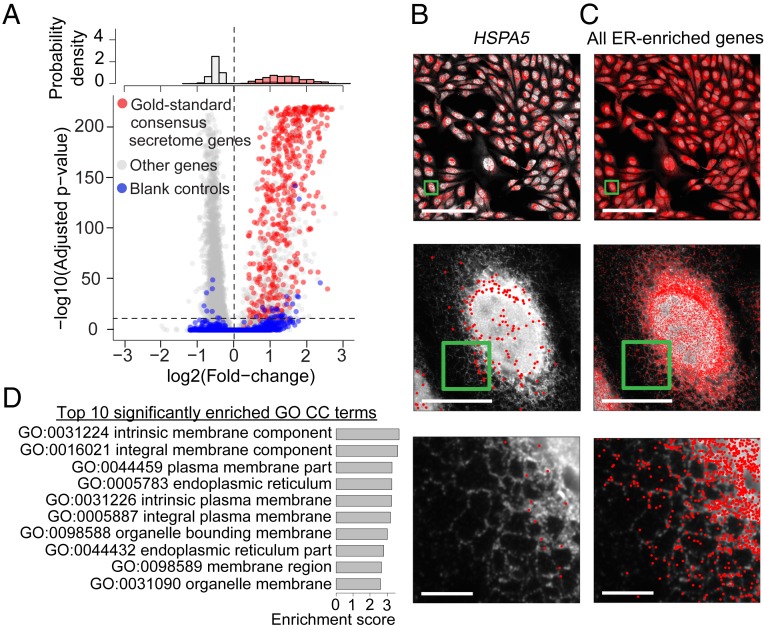
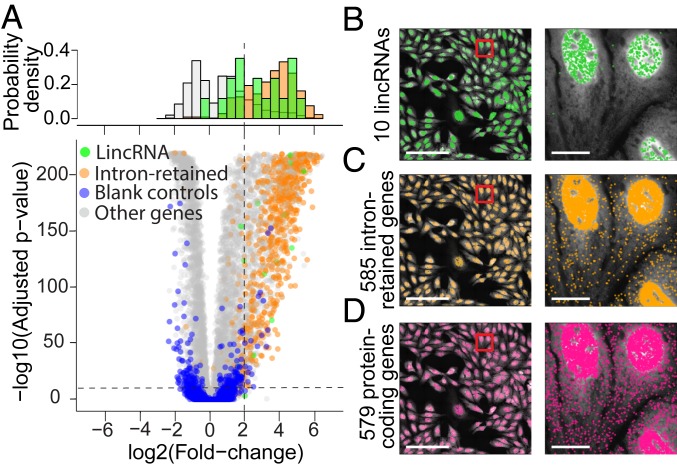
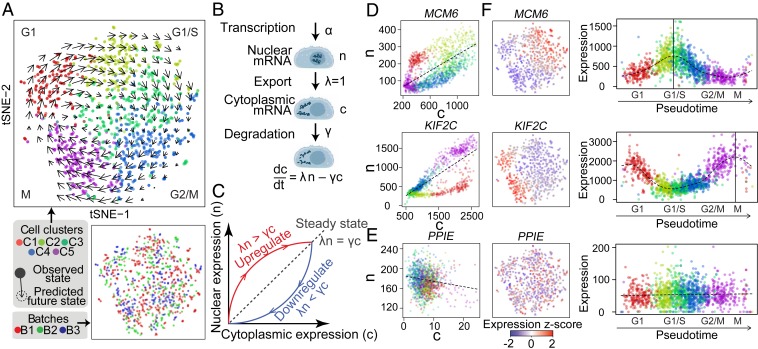
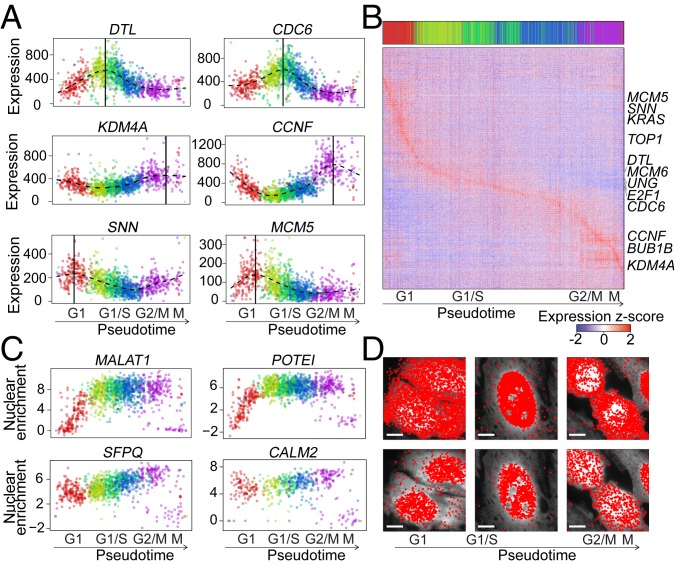
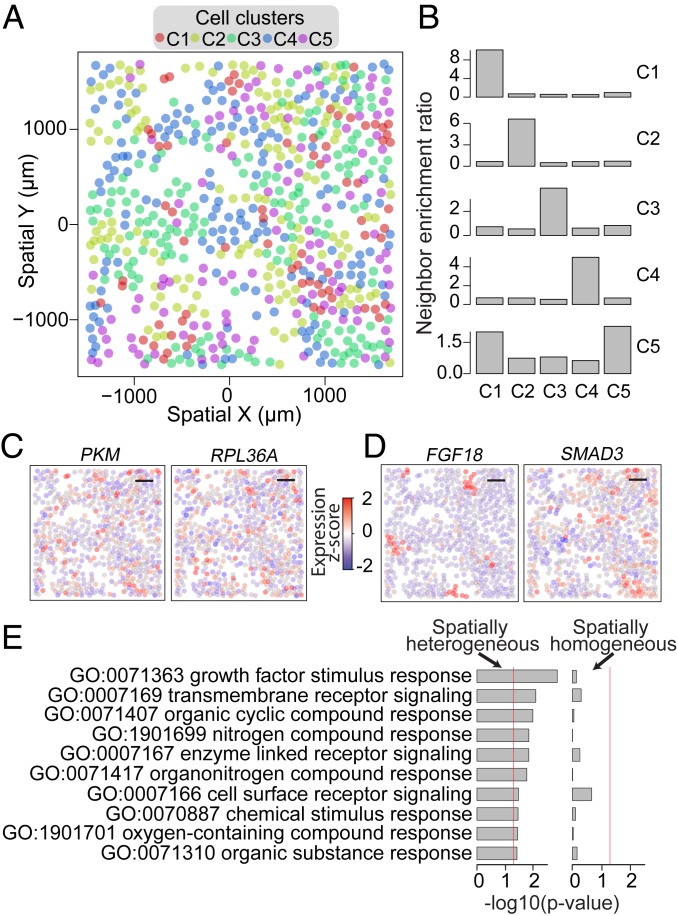
The expression profiles and spatial distributions of RNAs regulate many cellular functions. Image-based transcriptomic approaches provide powerful means to measure both expression and spatial information of RNAs in individual cells within their native environment. Among these approaches, multiplexed error-robust fluorescence in situ hybridization (MERFISH) has achieved spatially resolved RNA quantification at transcriptome scale by massively multiplexing single-molecule FISH measurements. Here, we increased the gene throughput of MERFISH and demonstrated simultaneous measurements of RNA transcripts from ∼10,000 genes in individual cells with ∼80% detection efficiency and ∼4% misidentification rate. We combined MERFISH with cellular structure imaging to determine subcellular compartmentalization of RNAs. We validated this approach by showing enrichment of secretome transcripts at the endoplasmic reticulum, and further revealed enrichment of long noncoding RNAs, RNAs with retained introns, and a subgroup of protein-coding mRNAs in the cell nucleus. Leveraging spatially resolved RNA profiling, we developed an approach to determine RNA velocity in situ using the balance of nuclear versus cytoplasmic RNA counts. We applied this approach to infer pseudotime ordering of cells and identified cells at different cell-cycle states, revealing ∼1,600 genes with putative cell cycle-dependent expression and a gradual transcription profile change as cells progress through cell-cycle stages. Our analysis further revealed cell cycle-dependent and cell cycle-independent spatial heterogeneity of transcriptionally distinct cells. We envision that the ability to perform spatially resolved, genome-wide RNA profiling with high detection efficiency and accuracy by MERFISH could help address a wide array of questions ranging from the regulation of gene expression in cells to the development of cell fate and organization in tissues.

Keywords: MERFISH; RNA velocity; fluorescence in situ hybridization; single-cell transcriptomics; spatial transcriptomics.


Conflict of interest statement

Conflict of interest statement: X.Z. is an inventor on patents applied for by Harvard University related to MERFISH.

Figures

Fig. 1.
Fig. 1.
MERFISH imaging of 10,050 genes in individual U-2 OS cells. (A) A high-pass-filtered, single-z slice, single-bit image of a U-2 OS sample stained with encoding probes targeting 10,050 RNA species, imprinting a 69-bit binary barcode onto each RNA species, and with an Alexa 750-labeled readout probe that detects 1 of the 69 bits of the barcodes. (Scale bar: 10 µm.) (B) A zoomed-in image of the region marked with the red box in A. (Scale bar: 1 µm.) (C) All identified RNA molecules (colored markers) detected from all 6 imaged z slices in the region depicted in A. (Scale bar: 10 µm.) (D) A zoomed-in image of all identified RNA molecules detected from all 6 imaged z slices in the region marked with the red box in C. (Scale bar: 1 µm.) In C and D, different colored dots mark RNA molecules with distinct barcodes. (E) The copy number per cell of RNA transcripts of each gene determined by MERFISH versus the fragments per kilobase of transcript per million mapped reads determined by bulk RNA sequencing for the 10,050 measured genes. The Pearson correlation coefficient is 0.83. (F) The copy number per cell detected in the 10,050-gene measurements vs. the copy number per cell in the 130-gene measurements for the 128 genes that are commonly present in both experiments. The median value of the ratios of the 10,050-gene measurements to the 130-gene measurements for each of the 128 common genes is 0.82. (G) Normalized histograms of the FPKM-normalized copy number per cell for the 9,050 genes that were labeled using the nonoverlapping encoding-probe design (blue) and for the 1,000 genes that were labeled using the overlapping encoding-probe design (orange). The medians of the FPKM-normalized copy number per cell for the 2 groups of genes are indicated by the blue and orange dotted lines, respectively. A high-resolution version of Fig. 1 can be found on Zenodo (DOI: 10.5281/zenodo.3380442).
Fig. 2.
Fig. 2.
Identification of RNAs enriched at the endoplasmic reticulum. (A) Quantification of the ER enrichment for each RNA species. The fold change between count-per-million-normalized transcript counts localized to the ER versus those localized in the non-ER region of the cytoplasm and the corresponding P values were calculated for each gene. In cpm normalization, the abundance of each RNA species was divided by the abundance of all RNA species in the corresponding cellular compartment and multiplied by a million for each cell. P values are determined based on a 2-sided pairwise Wilcoxon rank-sum test across all cells and adjusted for multiple testing using Bonferroni correction. (A, Bottom) The scatterplot of the P value versus fold change for each gene. Gold-standard consensus secretome genes, other genes, and blank control barcodes are marked in red, gray, and blue, respectively. The horizontal dashed line indicates the P = 1e-10 significance threshold and the vertical dashed line indicates log2(fold change) = 0. (A, Top) Histograms of the fold changes for the gold-standard consensus secretome genes (red) and other genes (gray). For the other genes, only those with P < 1e-10 are shown in the histogram. (B) Spatial distribution of an example gene, HSPA5, that is enriched at the ER, overlaid on the ER image. (C) Spatial distribution of all genes identified as highly significantly enriched (log2[fold change] > 0, P < 1e-10) at the ER overlaid on the ER image. Each red point in B and C represents the position of a transcript detected by MERFISH from all 6 imaged z slices. The ER images in B and C are from 1 of the 6 imaged z slices. In B and C, Middle and Bottom panels are zoomed-in images of the boxed regions in the Top and Middle panels, respectively. (Scale bars: B and C, Top, 500 μm; B and C, Middle, 50 μm; B and C, Bottom, 10 μm.) (D) Top 10 significantly enriched (FDR < 0.05) GO cellular component terms among the genes highly significantly enriched at the ER (as described above), ordered by GO term enrichment score.
Fig. 3.
Fig. 3.
Identification of RNAs enriched in the nucleus. (A) Quantification of nuclear enrichment for each RNA species. The fold change between cpm-normalized transcript counts in the nucleus versus those in the cytoplasm and the corresponding P values were calculated for each gene. P values are determined based on a 2-sided pairwise Wilcoxon rank-sum test across all cells and adjusted for multiple testing using Bonferroni correction. (A, Bottom) The scatterplot of the P value versus fold change for each gene. LincRNA, RNA with retained introns, other genes, and blank control barcodes are marked in green, orange, gray, and blue, respectively. The horizontal dashed line indicates the P = 1e-10 significance threshold and the vertical dashed line indicates the log2(fold change) = 2 threshold used to define genes with significant nuclear enrichment. (A, Top) Histograms of the fold changes for lincRNA (green), RNA with retained introns (orange), and other genes (gray). Only genes with P < 1e-10 are shown in these histograms. (BD) Spatial distribution of all identified lincRNAs (B), intron-retained RNAs (C), and protein-coding RNAs (D) that are highly significantly enriched in the nucleus (log2[fold change] > 2; P < 1e-10), overlaid onto the poly-dT staining image. Each colored point in BD indicates the spatial position of a detected transcript. In B–D, Right panels are zoomed-in images of the boxed regions in the Left panels. (Scale bars: B–D, Left, 500 μm; B–D, Right, 50 μm.)
Fig. 4.
Fig. 4.
Characterizations of transcriptionally distinct cell states and RNA velocity. (A) A 2D tSNE embedding of the gene expression profiles for 1,368 cells measured by MERFISH. Each point is a cell and is colored by the Louvain cluster annotations of the cell (Top) and by batch/replicate (Bottom). Projected velocity arrows show the RNA velocity as described in B. (B) Transcriptional dynamics model used to estimate RNA velocity. For each gene, the RNA velocity, defined as the rate of change in cytoplasmic RNA abundance (dc/dt), is modeled based on the transcription rate of the gene (α), rate constant of nuclear export (λ), and rate constant of RNA degradation (γ) given the observed mRNA abundance within the nucleus (n) and cytoplasm (c). Based on the RNA velocity, the future expression state of a cell can be predicted, and the projection from the current to future state is presented as arrows in A. (C) Schematic phase portrait of the nuclear versus cytoplasmic abundance of an RNA for various scenarios. The expected steady-state nuclear and cytoplasmic abundances for different transcription rates α fall on the diagonal (dotted line) with the slope γ/λ. The expected nuclear versus cytoplasmic abundance upon transcriptional up-regulation and down-regulation is depicted by the red and blue lines with arrows, respectively. (D) Phase portrait for 2 known cell cycle-related genes, MCM6 and KIF2C. Each point represents a cell and is colored by the cluster annotations as in A and, for each cell, mean cpm-normalized nucleus and cytoplasm expression magnitudes from 50 nearest-neighbor cells in PC space are shown, similar to phase portrait calculations in ref. . The steady state (dotted line) is estimated as the ratio between n and c using pooled cells from the lower- and upper-fifth extreme expression quantiles (SI Appendix, Materials and Methods). (E) Phase portrait for a known housekeeping gene, PPIE, as in D. (F) Expression visualization for the 3 genes described in D and E. (F, Left) tSNE embedding as in A colored by z-scored, cpm-normalized total cell expression level of the indicated gene. (F, Right) Cpm-normalized total gene expression magnitude versus pseudotime for each gene. Each point is a cell colored by its cluster annotation described in A. The top and bottom 0.1% of expression magnitude was winsorized. The dashed line indicates the smooth-spline fitted curve. The vertical solid line indicates the pseudotime at which the expression level reaches a maximum (from the fitted curve).
Fig. 5.
Fig. 5.
Variations in gene expression and nuclear enrichment across cell-cycle phases. (A) Cpm-normalized total expression magnitude, winsorized as in Fig. 4F, versus pseudotime for 3 selected genes identified to have cell cycle-dependent expression by the pseudotime analysis (Left) shown together with 3 known cell-cycle genes with similar pseudotime dependence (Right). Each point represents a cell and is colored by the cluster annotations. A smooth-spline curve is fitted for each gene (dashed line) and the pseudotime corresponding to the maximum expression of the fitted curve is determined (vertical solid line). (B) Heatmap of the cpm-normalized and z-scored expression magnitude of the 1,654 genes identified to have cell cycle-dependent expression as a function of pseudotime. The cells are sorted by the pseudotime and the genes are sorted by the pseudotime point of maximum expression (as determined from the fitted curve). Selected cell-cycle genes are labeled. The colored bar at the top denotes the cell’s cluster annotation. (C) Nuclear enrichment (log2 of cpm-normalized nuclear and cytoplasmic expression ratio) versus pseudotime for 4 select genes. Each point represents a single cell colored by its cluster annotation. MALAT1 and POTEI (Top) exhibit gradual reestablishment of nuclear enrichment after mitosis whereas SFPQ and CALM2 (Bottom) exhibit instantaneous reestablishment of nuclear enrichment after mitosis. (D) Spatial distribution of all genes determined to have gradual recovery of nuclear enrichment similar to MALAT1 and POTEI (Top) or instantaneous recovery of nuclear enrichment similar to SFPQ and CALM2 (Bottom) for cells at 3 distinct pseudotime points (columns). Each red dot indicates the position of 1 transcript detected by MERFISH overlaid on the poly-dT staining image. (Scale bars: 20 μm.)
Fig. 6.
Fig. 6.
Spatial heterogeneity of transcriptionally distinct cells. (A) Centroid positions of the cells measured in 1 MERFISH replicate (points) colored by the corresponding cell’s cluster annotation. (B) Bar plots of neighbor enrichment ratios for cells assigned to each of the 5 clusters. For cells in the C1 cluster (Top), the neighbor enrichment ratio is calculated by first partitioning the cells into 2 sets: a neighbor cell set containing all cells that are within the 3 nearest neighbors of any cell in the C1 cluster and a nonneighbor cell set containing all other cells. The enrichment ratios for cells in a particular cluster (Cx, x = 1 to 5) in the neighborhood of C1 cells are defined as the ratio between the fraction of cells in the neighbor set that belong to the Cx cluster and the fraction of cells in the nonneighbor set that belong to the Cx cluster. The enrichment ratios in the neighborhood of C2, C3, C4, and C5 cells are determined similarly and shown in the 4 panels below. All clusters’ spatial neighborhood exhibits significant enrichment (Fisher’s exact P < 1e-10) for cells in the same cluster. (C and D) Spatial expression profiles for select overdispersed non-cell cycle-related genes that do not exhibit significant spatial heterogeneity in expression (Moran’s I Bonferroni-corrected P > 0.05) (C) or exhibit highly significant spatial heterogeneity in expression (Moran’s I Bonferroni-corrected P < 1e-10) (D). Each point indicates the spatial position of a cell and is colored based on the z-scored, cpm-normalized expression magnitude of PKM and RPL36A (C) and FGF18 and SMAD3 (D). (Scale bars: C and D, 500 μm.) (E) Gene set enrichment P values for a set of significantly enriched gene sets identified for genes that exhibit highly significant (Moran’s I Bonferroni-corrected P < 1e-10) spatial heterogeneity (Left) and P values of the same gene sets for genes that appear spatially homogeneous, i.e., do not exhibit significant (Moran’s I Bonferroni-corrected P > 0.05) spatial heterogeneity (Right). The red lines indicate the P = 0.05 significance threshold.

References

    1. Buxbaum A. R., Haimovich G., Singer R. H., In the right place at the right time: Visualizing and understanding mRNA localization. Nat. Rev. Mol. Cell Biol. 16, 95–109 (2015). - PMC - PubMed
    1. Engreitz J. M., Ollikainen N., Guttman M., Long non-coding RNAs: Spatial amplifiers that control nuclear structure and gene expression. Nat. Rev. Mol. Cell Biol. 17, 756–770 (2016). - PubMed
    1. Crosetto N., Bienko M., van Oudenaarden A., Spatially resolved transcriptomics and beyond. Nat. Rev. Genet. 16, 57–66 (2015). - PubMed
    1. Lein E., Borm L. E., Linnarsson S., The promise of spatial transcriptomics for neuroscience in the era of molecular cell typing. Science 358, 64–69 (2017). - PubMed
    1. Levsky J. M., Shenoy S. M., Pezo R. C., Singer R. H., Single-cell gene expression profiling. Science 297, 836–840 (2002). - PubMed

Publication types

MeSH terms

LinkOut - more resources