. 2019 Sep 9;10(9):649.
doi: 10.1038/s41419-019-1882-9.

Protease Nexin I is a feedback regulator of EGF/PKC/MAPK/EGR1 signaling in breast cancer cells metastasis and stemness

Affiliations

Protease Nexin I is a feedback regulator of EGF/PKC/MAPK/EGR1 signaling in breast cancer cells metastasis and stemness

Tingting Tang et al. Cell Death Dis. .

Erratum in

Abstract

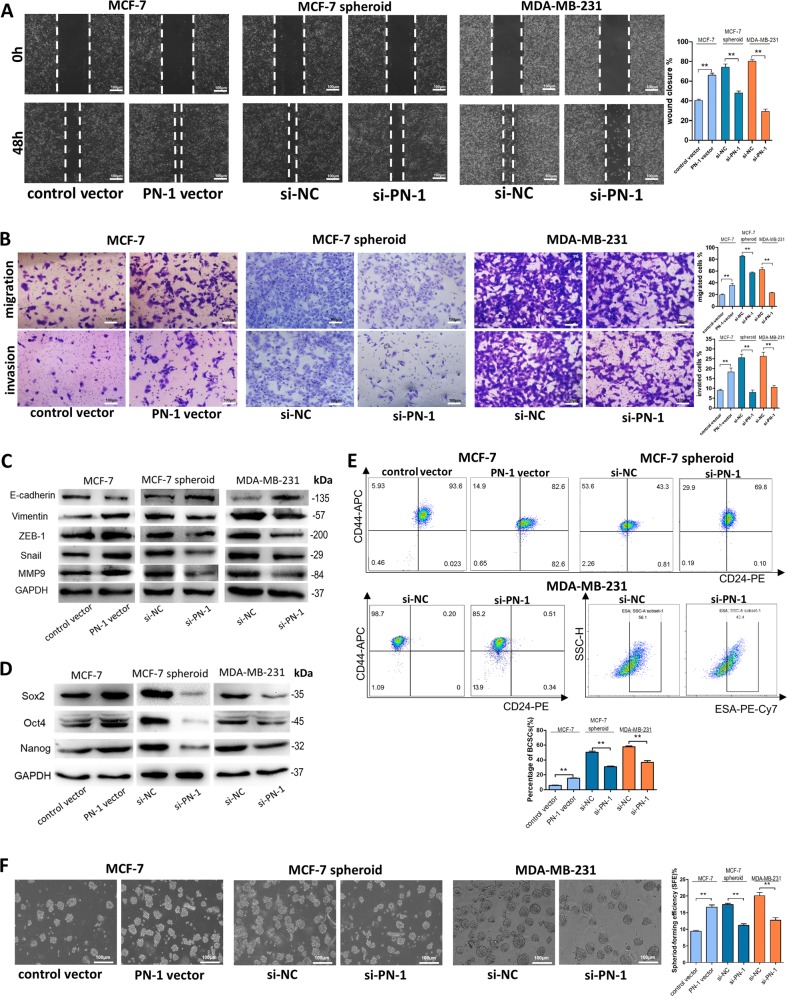
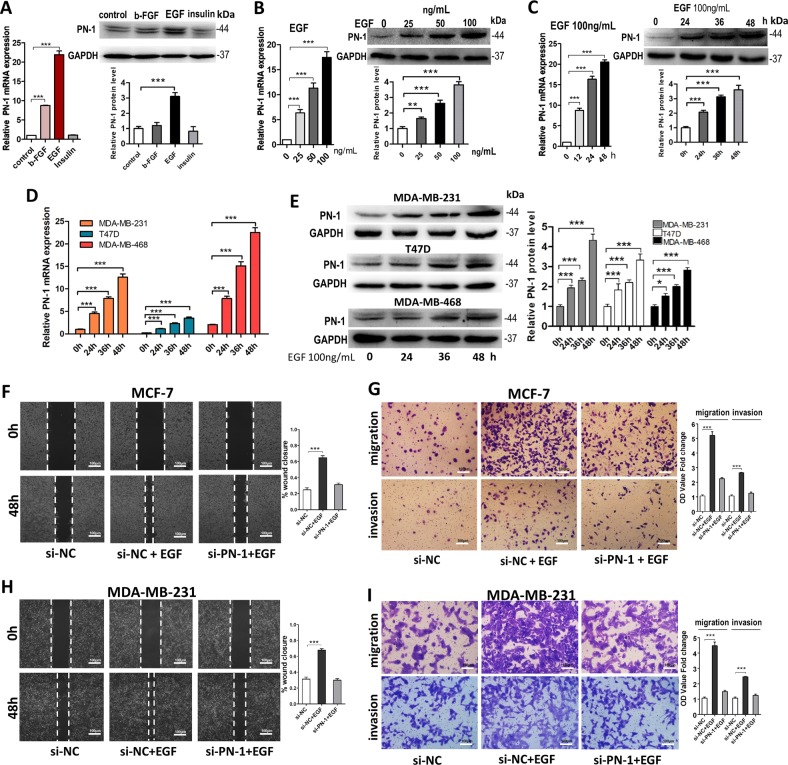
Breast cancer is the most prevalent cancer in women worldwide, which remains incurable once metastatic. Breast cancer stem cells (BCSCs) are a small subset of breast cancer cells, which are the radical cause of drug resistance, tumor relapse, and metastasis in breast cancer. The extracellular serine protease inhibitor serpinE2, also named protease nexin-1 (PN-1), contributes to enhanced metastasis of cancer cells mainly by remodeling the tumor matrix. In this study, we found that PN-1 was up-regulated in breast cancer, which promoted cell invasion, migration and stemness. Furthermore, by using specific inhibitors, we discovered that epidermal growth factor (EGF) up-regulated PN-1 in breast cancer cells through cascade activation of epidermal growth factor receptor (EGFR) to the activation of protein kinase Cδ (PKCδ), mitogen-activated protein kinase (MEK) and extracellular signal-related kinase (ERK), which finally led to the up-regulation of early growth response protein 1 (EGR1). Moreover, EGF signaling was further activated as a feedback of PN-1 up-regulation through PN-1 blocking HtrA1. Taken together, our findings revealed a novel signaling axis that up-regulated PN-1 expression in breast cancer cells, and the new mechanism of PN-1-promoted breast cancer metastasis, which may provide new insights into identifying novel therapeutic targets for breast cancer.


Conflict of interest statement

The authors declare that they have no conflict of interest.

Figures

Fig. 1
Fig. 1. PN-1 is up-regulated in breast cancer cells.
a Bright field images (upper) and CD44+/CD24− population percentage (lower) of MCF-7 cells formation under monolayer culture condition and 3D culture condition (scale bar: 100 μm), respectively. b Protein levels of BCSC surface markers and pluripotency-maintaining markers in MCF-7 parental and spheroid cells. c The heat maps of top-20 up- or down-regulated mRNAs between MCF-7 cells and MCF-7 spheroid cells. Each group contains three batches of individual samples, which were pooled and mixed. d Verification of the top-5 up-regulated and down-regulated mRNAs by qRT-PCR in MCF-7 spheroid cells compared with MCF-7 cells. e PN-1 mRNA(left) and protein(right) levels in MCF-7 cells and MCF-7 spheroid cells. f Expression levels of PN-1 in 1104 breast cancer tissues and 103 normal breast tissues in starBase public database from TCGA project (P < 0.05). g PN-1 mRNA levels were detected in 70 pairs of human breast cancer tissues and corresponding distal non-cancerous tissues by qRT-PCR. h PN-1 mRNA levels in breast cancer patients with different tumor grades, sizes and histological, and in patients with different tumor size, with (indicated with “yes”) or without (indicated with “no”) lymph node metastasis. i PN-1 protein levels were detected in 12 pairs of human breast cancer tissues (indicated by “Cancer # number of patient”) and corresponding distal non-cancerous tissues (indicated by “Normal # number of patient”) by western blotting. j The TCGA database indicated that patients with high levels of PN-1 expression showed reduced survival rate compared with patients with low levels of PN-1 expression by Kaplan-Meier survival analysis. (P< 0.05, log-rank test). ***P < 0.005.
Fig. 2
Fig. 2. PN-1 promotes breast cancer cells migration, invasion and stemness in vitro.
a, b Representative images and quantitative analysis of migration and invasion of MCF-7 cells transfected with control vector or PN-1 vector, MCF-7 spheroid cells transfected with si-NC or si-PN-1, and MDA-MB-231 cells transfected with si-NC or si-PN-1 detected by wound healing assay (scale bar: 100 μm) (a), transwell migration assay and transwell invasion assay (scale bar: 100 μm) (b). c E-cadherin, Vimentin, ZEB-1, Snail, and MMP-9 protein levels in MCF-7 cells transfected with control vector or PN-1 vector, MCF-7 spheroid cells transfected with si-NC or si-PN-1, and MDA-MB-231 cells transfected with si-NC or si-PN-1. d Sox2, Oct4, and Nanog protein levels in MCF-7 cells transfected with control vector or PN-1 vector, MCF-7 spheroid cells transfected with si-NC or si-PN-1, and MDA-MB-231 cells transfected with si-NC or si-PN-1. e The percentage of CD44+/CD24− population in MCF-7 cells transfected with control vector or PN-1 vector, MCF-7 spheroid cells transfected with si-NC or si-PN-1, and MDA-MB-231 cells transfected with si-NC or si-PN-1. f Sphere-formation efficiency of MCF-7 cells transfected with control vector or PN-1 vector, MCF-7 spheroid cells transfected with si-NC or si-PN-1, and MDA-MB-231 cells transfected with si-NC or si-PN-1. (scale bar: 100 μm) **P < 0.01, ***P < 0.005.
Fig. 3
Fig. 3. EGF up-regulates PN-1 expression in breast cancer lines.
a PN-1 mRNA (left) and protein (right) levels in MCF-7 cells under stimulation of bFGF, EGF, and insulin. b, c PN-1 mRNA(left) and protein(right) levels in MCF-7 cells under stimulation of EGF at different doses(b) and for different time durations (c). d, e PN-1 mRNA(D) and protein (e) levels in MDA-MB-231 cells, T47D cells and MDA-MB-468 cells under stimulation of EGF for different time durations. f–i Migration and invasion of MCF-7 cells (f, g) and MDA-MB-231 (h, i) transfected with si-NC, transfected with si-NC and stimulated by EGF, or transfected with si-PN-1 and stimulated by EGF. detected by wound healing assay, transwell migration assay and transwell invasion assay. (scale bar: 100 μm) *P < 0.05, ***P < 0.005.
Fig. 4
Fig. 4. EGF induces PN-1 expression through EGFR and PKC activation.
a PN-1, P-EGFR, and EGFR protein levels in control MCF-7 cells, MCF-7 cells treated with EGF, and MCF-7 cells treated with EGF and AG1478 (EGFR inhibitor). b PN-1 and EGFR mRNA levels in MCF-7 cells, MDA-MB-231 cells, T47D cells and MDA-MB-468 cells. c PN-1 and EGFR protein levels in MCF-7 cells, MDA-MB-231 cells, T47D cells and MDA-MB-468 cells. d Spearman correlation analysis of the fold change of EGFR mRNA and PN-1 mRNA in human breast cancer tissues. e Spearman correlation analysis of the fold change of EGFR mRNA and PN-1 mRNA in 1104 human breast cancer tissues in starBase public database from TCGA project. f Schematic diagram shows specific inhibitors of different proteins involved in EGF/EGFR signaling pathway. g, h PN-1 mRNA(I) and protein(J) levels in control MCF-7 cells, MCF-7 cells treated with EGF, MCF-7 cells treated with EGF and inhibitors of PI3K(LY294002), PLC(U73122), JAK(Ruxolitinib), MEK(U0126) or PKC(Go6983). i PN-1 protein levels in control MCF-7 cells, MCF-7 cells treated with EGF, MCF-7 cells treated with EGF and Go6983. j Schematic diagram shows the inhibitors of different PKC isoforms. k, l PN-1 mRNA(M) and protein(N) levels in control MCF-7 cells, MCF-7 cells treated with EGF, MCF-7 cells treated with EGF and BAPT-AM (Calcium inhibitor) or rottlerin (PKCδ and PKCθ inhibitor). ***P < 0.005.
Fig. 5
Fig. 5. EGF-EGFR-PKC-MAPK pathway is responsible for the EGF-induced PN-1 overexpression.
a PN-1 mRNA(left) and protein(right) levels in control MCF-7 cells, MCF-7 cells treated with EGF, and MCF-7 cells treated with EGF and U0126 (MEK inhibitor). b PN-1 mRNA (left) and protein (right) levels in control MCF-7 cells, MCF-7 cells treated with EGF, and MCF-7 cells treated with EGF and SCH772984 (ERK inhibitor). c, d PN-1 mRNA levels(F) and PN-1, P-ERK1/2 and ERK1/2 protein levels(G) in control MCF-7 cells, MCF-7 cells treated with PMA, and MCF-7 cells treated with PMA and U0126 or SCH772984. e PN-1 mRNA (left) and protein (right) levels in MDA-MB-231cells treated with EGF, MDA-MB-231 cells treated with EGF and AG1478, Go6983, U0126, or SCH772984. ***P < 0.005.
Fig. 6
Fig. 6. Transcription factor EGR1 was involved in EGF-activated PN-1 up-regulation.
a Predicted binding sites of top-3 ranked transcription factors in PN-1 promoter region by JASPAR database. b PN-1 mRNA(left) and protein(right) levels in control MCF-7 cells, MCF-7 cells treated with EGF, MCF-7 cells treated with EGF and mithramycin A (GC-rich-binding agent). c EGR1 and PN-1 mRNA(left) and protein(right) levels in MCF-7 cells transfected with si-NC, transfected with si-NC and stimulated by EGF, or transfected with si-EGR1 and stimulated by EGF. d Spearman correlation analysis of the fold change of EGR1 mRNA and PN-1 mRNA in 1104 human breast cancer tissues in starBase public database from TCGA project. e EGR1 mRNA(left), EGR1 and PN-1 protein(right) levels in in control MCF-7 cells, MCF-7 cells treated with EGF, and MCF-7 cells treated with EGF and SCH772984. f Sequence logo of EGR1 from JASPAR database. g The verification of EGR1 binding to the promoter region of PN-1 by luciferase reporter assay. Plasmid-con, Plasmid-EGR1, PGL3-basic and PGL3-PN-1 vectors which included different regions of PN-1 promoter were transfected into MCF-7 cells for 48 h, then luciferase was checked. h Putative EGR1-binding sites on the promoter region of PN-1 by JASPAR (upper) and the enrichment of EGR1 on PN-1 promoter relative to IgG in MCF-7 cells detected by ChIP assay (lower). A random region (Neg) without DNA binding elements (DBEs) of EGR1 served as a negative control. i Mutagenesis in the putative binding site (−49~−16 bp fragment of the PN-1 promoter) abrogated the induction activity of EGR1 in the MCF-7 cells. j P-EGFR, PKCδ, P-ERK1/2, EGR1, and PN-1 protein levels in control MCF-7 cells (left) or MDA-MB-231 cells (right), MCF-7 cells (left) or MDA-MB-231 cells (right) transfected with si-NC, si-EGFR, si- PKCδ, si-ERK or si-EGR1 and treated with EGF. **P < 0.01, ***P < 0.005.
Fig. 7
Fig. 7. Effects of EGF-induced PN-1 on the lung colonization of breast cancer cells xenografts in mice.
a Experimental design. Immunocompromised mice were injected through tail vein with either MCF-7 cells transfected with control lentivirus, transfected with control lentivirus and treated with EGF, transfected with PN-1 lentivirus, transfected with sh-PN-1 lentivirus and treated with EGF, or MDA-MB-231 cells transfected with control lentivirus or sh-PN-1 lentivirus. For group 2 and 4, EGF was also injected intraperitoneally at 10 μg/kg body weight every 3 days. b PN-1 protein levels in MCF-7 cells transfected with control lentivirus, transfected with control lentivirus and treated with EGF, transfected with PN-1 lentivirus, transfected with sh-PN-1 lentivirus and treated with EGF, and in MDA-MB-231 cells transfected with control lentivirus or sh-PN-1 lentivirus. c Representative BLI images of four groups. The BLI was performed on day 5, 20, and 40 after injection. The intensity of BLI is represented by the color. d Whole body bioluminescence (photons/second) following tail vein injection of breast cancer cells in mice. e Mice lungs (upper) and livers (lower) were subjected to H&E staining respectively. (Scale bar:100 μm) ***P < 0.005.
Fig. 8
Fig. 8. PN1 acts as a positive-feedback regulator of EGF/ERK/EGR1 signaling through binding and inhibiting HtrA1.
a Concentration of EGF (pg/mL) in culture medium of MCF-7 cells transfected with control vector or PN-1 vector, si-NC or si-PN-1 for 24, 48 or 72 h detected by ELISA. b p-EGFR, EGFR, p-PKCδ, PKCδ, p-ERK1/2, ERK1/2 and EGR1 protein levels in MCF-7 cells transfected with control vector, PN-1 vector, si-NC or si-PN-1 for 48 h. c EGF mRNA(left) and protein(right) levels in MCF-7 cells transfected with control vector or PN-1 vector, si-NC or si-PN-1. d Concentration of EGF (pg/mL) in culture medium of MCF-7 cells transfected with control vector or HtrA1 vector, si-NC or si- HtrA1 for 72 h detected by ELISA. e EGF mRNA levels in MCF-7 cells transfected with control vector or HtrA1 vector, si-NC or si- HtrA1. f HtrA1 co-immunoprecipitates with PN1, and PN1 in turn co-immunoprecipitates with HtrA1 in MCF-7 cells. g Schematic diagram of the assay designed to assess the effect of extracellular HtrA1 on the regulation of the EGF signaling pathway. MCF-7 cells, which were transfected with control vector or PN-1 vector, si-NC or si-PN-1, were treated with the EGF for 30 min. The effect of the enzyme-substrate pair HtrA1 and EGF on the EGF signaling pathway in the extracellular region was assessed by the extent of P-EGFR. h P-EGFR, EGFR and HtrA1 protein levels in control MCF-7 cells and MCF-7 cells transfected with control vector or PN-1 vector, si-NC or si-PN-1, and treated with the EGF. i Migration and invasion of MCF-7 cells transfected with control vector, HtrA1 vector, or HtrA1 vector plus PN-1 vector detected by transwell migration assay and transwell invasion assay. j A working model for the regulation of PN-1 by EGF/EGFR/PKCδ/MEK/ERK/EGR1 signaling pathway in breast cancer cells. During breast tumorigenesis, EGF is up-regulated in tumor microenvironment and binds with EGFR, which leading to the activation of the downstream kinase cascades including PKCδ, MEK, and ERK, finally induces the expression of PN-1 via up-regulation of its transcription factor, EGR1. PN-1 promotes migration, invasion and stemness of breast cancer cells and further provides a positive-feedback towards the activation of EGF signals through preventing EGF cleavage by HtrA1. *P < 0.05, ** P < 0.01, ***P < 0.005.

References

    1. Bray Freddie, Ferlay Jacques, Soerjomataram Isabelle, Siegel Rebecca L., Torre Lindsey A., Jemal Ahmedin. Global cancer statistics 2018: GLOBOCAN estimates of incidence and mortality worldwide for 36 cancers in 185 countries. CA: A Cancer Journal for Clinicians. 2018;68(6):394–424. - PubMed
    1. Kozlowski J, Kozlowska A, Kocki J. Breast cancer metastasis—insight into selected molecular mechanisms of the phenomenon. Postepy Hig. Med Dosw (Online) 2015;69:447–451. - PubMed
    1. Cao JY, et al. Twist promotes tumor metastasis in basal-like breast cancer by transcriptionally upregulating ROR1. Theranostics. 2018;8:2739–2751. - PMC - PubMed
    1. Geng SQ, Alexandrou AT, Li JJ. Breast cancer stem cells: multiple capacities in tumor metastasis. Cancer Lett. 2014;349:1–7. - PMC - PubMed
    1. Liu BJ, et al. miR-200c/141 regulates breast cancer stem cell heterogeneity via targeting HIPK1/beta-catenin axis. Theranostics. 2018;8:5801–5813. - PMC - PubMed

Publication types

MeSH terms