. 2019 Sep 9;10(9):651.
doi: 10.1038/s41419-019-1905-6.

The fine-tuning of endoplasmic reticulum stress response and autophagy activation during trophoblast syncytialization

Affiliations

The fine-tuning of endoplasmic reticulum stress response and autophagy activation during trophoblast syncytialization

Daniel Bastida-Ruiz et al. Cell Death Dis. .

Abstract

The syncytiotrophoblast (STB) is a multinuclear layer forming the outer surface of the fetal part of the placenta deriving from villous cytotrophoblastic cell (vCTB) fusion and differentiation. This syncytialization process is characterized by morphological and biochemical alterations of the trophoblast, which probably require removal of pre-existing structures and proteins to maintain cell homeostasis and survival. Interestingly, autophagy, which allows degradation and recycling of cellular components, was shown to be activated in syncytiotrophoblast. Here we examined the involvement of endoplasmic reticulum stress (ERS) response in autophagy activation during vCTB syncytialization. We first demonstrated the activation of ERS response and autophagy during the time course of trophoblastic cell fusion and differentiation. Alteration of autophagy activation in vCTB by chemical treatments or Beclin-1 expression modulation leads to a decrease in trophoblastic syncytialization. Furthermore, ERS response inhibition by chemical treatment or siRNA strategy leads to a default in syncytialization, associated with alteration of autophagy markers and cell survival. From these data, we suggest that ERS response, by fine regulation of autophagy activation, may serve as an adaptive mechanism to promote cell survival during trophoblastic syncytialization.


Conflict of interest statement

The authors declare that they have no conflict of interest.

Figures

Fig. 1
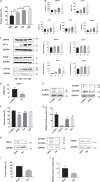
Fig. 1. Role of unfolded protein response in cell fusion and differentiation of BeWo cells.
ac BeWo cells were seeded, and 24 h later treated with 100 µM Forskolin (FSK) for 24, 36 and 48 h. a Nuclei and syncytia were counted and fusion index was calculated. b RNA was retrotranscribed and 10 ng of cDNA were used to perform qPCR. c- Western blotting was performed on the cells. Proteins levels were quantified using the ImageJ software, and data are expressed as the fold change relative to the control. n = 3. Data represented as mean ± SEM. *P ≤ 0.05; **P ≤ 0.01; t test comparison test. df BeWo cells were treated 24 h after cell seeding with 10 µM HA15 for 48 h. d Western blotting was performed on the cells. e Nuclei and syncytia were counted and fusion index was calculated. f β-Human chorionic gonadotropin (β-hCG) was measured in culture supernatant by ELISA, normalized to the protein content and expressed relative to the control. n = 3. Data represented as mean ± SEM. *P ≤ 0.05; ****P ≤ 0.0001; t test comparison test. gj BeWo cells were seeded, and 24 h later treated with 10 µM HA15 and 200 µM 4-(2-aminoethyl) benzenesulfonyl fluoride hydrochloride (AEBSF), 100 µM STF-083010 (STF), 100 nM GSK2656157 (GSK) or DMSO (Control DMSO, Cnt DMSO) for 48 h. g RNA was retrotranscribed and 10 ng of cDNA were used to perform qPCR. h Western blotting was performed on the cells. i Nuclei and syncytia were counted and fusion index was calculated. j β-Human chorionic gonadotropin (β-hCG) was measured in culture supernatant by ELISA, normalized to the protein content and expressed relative to the control. n = 3. Data represented as mean ± SEM. *P ≤ 0.05; ***P < 0.001; ****P ≤ 0.0001; t test comparison test
Fig. 2
Fig. 2. Role of unfolded protein response in cell fusion and differentiation of primary villous cytotrophoblastic cells.
ac Villous cytotrophoblastic (vCTB) cells were purified from human term placenta and seeded for 24, 48, 72, and 96 h. a Nuclei and syncytia were counted and fusion index was calculated. b RNA was retrotranscribed and 10 ng of cDNA were used to perform qPCR. n = 5. c Western blotting was performed on the cells. Proteins levels were quantified using the ImageJ software, and data are expressed as the fold change relative to 24 h of culture. n = 4. Data represented as mean ± SEM. *P ≤ 0.05; **P ≤ 0.01; t test comparison test. dg vCTB were purified from human term placenta and seeded for 24 h prior treatment with 200 µM 4-(2-aminoethyl)benzenesulfonyl fluoride hydrochloride (AEBSF), 100 µM STF-083010 (STF), 100 nM GSK2656157 (GSK), or DMSO (Control DMSO, Cnt DMSO) for 48 h. d RNA was retrotranscribed and 10 ng of cDNA were used to perform qPCR. n = 4. e Western blotting was performed on the cells. n = 4. f Nuclei and syncytia were counted and fusion index was calculated. g β-Human chorionic gonadotropin (β-hCG) was measured in culture supernatant by ELISA, normalized to the protein content and expressed relative to the control. n = 3. Data represented as mean ± SEM. *P ≤ 0.05; ***P ≤ 0.001; ****P ≤ 0.0001; t test comparison test. hj vCTB were purified from human placenta and seeded; 24 h later, cells were transfected with 16.6 nM of siATF6, 16.6 nM of siPERK, and 16.6 nM of siIRE1α (3si) or 50 nM of control siRNA (sicnt). h Western blotting was performed on the cells. n = 3. i Nuclei and syncytia were counted and fusion index was calculated. n = 3. j β-Human chorionic gonadotropin (β-hCG) was measured in culture supernatant by ELISA, normalized to the protein content and expressed relative to the control. n = 3. Data represented as mean ± SEM. *P ≤ 0.05; ***P ≤ 0.001 t test comparison test
Fig. 3
Fig. 3. Activation of autophagy during syncytialization.
a Primary trophoblastic cells were labeled with acridine orange 24, 48, 72 and 96 h after seeding and observed by fluorescence microscopy. Scale bar represents 100 μm. b Acridine orange quantification of the intensity and area of red signal, normalized to the total number of nuclei. n = 4. Data represented as mean ± SEM. **P ≤ 0.01; ***P ≤ 0.001; ****P ≤ 0.0001; t test comparison test. c Cells were labeled with anti-LC3b antibodies (green), anti-γ-catenin (red), and 4′,6-diamidino-2-phenylindole (DAPI) (nuclei, blue) and observed by fluorescence microscopy 24, 48, 72, and 96 h after seeding. Scale bar represents 100 μm. n = 3. d Western blotting was performed on the cells. LC3b-II and GAPDH levels were quantified using the ImageJ software, and data are expressed as the fold change relative to 24 h of culture. n = 4. Data represented as mean ± SEM. *P ≤ 0.05; ANOVA comparison test
Fig. 4
Fig. 4. Consequences of autophagy modulation with autophagy inhibitors or activators on trophoblastic cell fusion and differentiation.
vCTB were purified from human term placenta and seeded for 24 h prior treatment with 10 nM Bafilomycin A1 (BAF), 2 µM Chloroquine (CQ), 10 nM Trichostatin A (TRI), 200 µM Valproic acid (VA), or Ethanol (Control Ethanol, Cnt Eth) for 48 h. a, b Western blotting was performed on the cells. LC3b-II and GAPDH levels were quantified using the ImageJ software, and data are expressed as the fold change relative to the control. n = 4. Data represented as mean ± SEM. *P ≤ 0.05; ANOVA comparison test. c Cells were labeled with acridine orange 48 h post-treatment and observed by fluorescence microscopy. Scale bar represents 100 μm. d Acridine orange quantification of the intensity and area of red signal, normalized to the total number of nuclei. n = 4. Data represented as mean ± SEM. *P ≤ 0.05; **P ≤ 0.01; t test comparison test. e Trophoblastic cells were labeled with anti-LC3b antibodies (green), anti-γ-catenin (red), and 4′,6-diamidino-2-phenylindole (DAPI) (nuclei, blue) and observed by fluorescence microscopy 48 h post-treatment. Scale bar represents 100 μm. n = 3 f Nuclei and syncytia were counted and fusion index was calculated. n = 4. Data represented as mean ± SEM. ***P ≤ 0.001; ****P ≤ 0.0001; t test comparison test. g β-Human chorionic gonadotropin (β-hCG) was measured in culture supernatant by ELISA, normalized to the protein content and expressed relative to the control. n = 3. Data represented as mean ± SEM. *P ≤ 0.05; ***P ≤ 0.001; ****P ≤ 0.0001; t test comparison test
Fig. 5
Fig. 5. Consequences of autophagy modulation by Beclin-1 overexpression or silencing on syncytialization.
ag vCTB were purified from human term placenta and seeded for 24 h prior transfection with Cnt EV, Beclin-1, Cnt siRNA, or siBeclin-1 for 48 h. a RNA was retrotranscribed and 10 ng of cDNA were used to perform qPCR using primers for Beclin-1. n = 3. Data represented as mean ± SEM. b Western blotting was performed on the cells. LC3b-II and GAPDH levels were quantified using the ImageJ software, and data are expressed as the fold change relative to the control. *P ≤ 0.05; ***P ≤ 0.001; ANOVA comparison test. n = 3. c Cells were labeled with acridine orange 48 h post-transfection and observed by fluorescence microscopy. Scale bar represents 100 μm. d Acridine orange quantification of the intensity and area of red signal, normalized to the total number of nuclei. n = 3. Data represented as mean ± SEM. *P ≤ 0.05; t test comparison test. e Cells were labeled with anti-LC3b antibodies (green), anti-γ-catenin (red), and 4′,6-diamidino-2-phenylindole (DAPI) (nuclei, blue) and observed by fluorescence 48 h post-transfection. Scale bar represents 100 μm. f Nuclei and syncytia were counted and fusion index was calculated. n = 3. Data represented as mean ± SEM. ***P ≤ 0.001; ****P ≤ 0.0001; t test comparison test. g β-Human chorionic gonadotropin (β-hCG) was measured in culture supernatant by ELISA, normalized to the protein content and expressed relative to the control. n = 3. Data represented as mean ± SEM. ***P ≤ 0.001; ****P ≤ 0.0001; t test comparison test
Fig. 6
Fig. 6. Effect of UPR modulation on autophagy activation in trophoblastic cells.
vCTB were purified from human term placenta and seeded for 24 h prior treatment with 100 nM GSK2656157 (GSK), 100 µM STF-083010 (STF), 200 µM 4-(2-aminoethyl)benzenesulfonyl fluoride hydrochloride (AEBSF), or DMSO (Control DMSO, Cnt DMSO) for 48 h. a Cells were labeled with acridine orange 48 h post-treatment and observed by fluorescence microscopy. Scale bar represents 100 μm. b Acridine orange quantification of the intensity and area of red signal, normalized to the total number of nuclei. n = 4. Data represented as mean ± SEM. *P ≤ 0.05; **P ≤ 0.01; t test comparison test. c Cells were labeled with anti-LC3b antibodies (green), anti-γ-catenin (red), and 4′,6-diamidino-2-phenylindole (DAPI) (nuclei, blue) and observed by fluorescence microscopy 48 h post-treatment. Scale bar represents 100 μm. d Western blotting was performed on the cells. LC3b-II and GAPDH levels were quantified using the ImageJ software, and data are expressed as the fold change relative to the control. n = 4. Data represented as mean ± SEM. *P ≤ 0.05; ANOVA comparison test
Fig. 7
Fig. 7. Role of UPR in autophagy activation and cell survival during syncytialization.
af vCTB were purified from human term placenta. Twenty-four hours after seeding, vCTB cells were transfected with 16.6 nM of siATF6, 16.6 nM of siPERK, and 16.6 nM of siIRE1α (3si) or 50 nM of control siRNA (sicnt). a Cells were labeled with acridine orange 48 h post-transfection and observed by fluorescence microscopy. Scale bar represents 100 μm. b Acridine orange quantification of the intensity and area of red signal, normalized to the total number of nuclei. n = 3. Data represented as mean ± SEM. **P ≤ 0.01; t test comparison test. c Cells were labeled with anti-LC3b antibodies (green), anti-γ-catenin (red), and 4′,6-diamidino-2-phenylindole (DAPI) (nuclei, blue) and observed by fluorescence 48 h post-transfection. Scale bar represents 100 μm. d Western blotting was performed on the cells. LC3b-II and GAPDH levels were quantified using the ImageJ software, and data are expressed as the fold change relative to the control. n = 3. Data represented as mean ± SEM. *P ≤ 0.05; t test comparison test. e Flow cytometric analysis of trophoblastic cells and labeled with Annexin V-FITC and PI was performed 48 h after transfection. n = 3. f Cell viability was measured 120 h after transfection with the CellTiter-Glo Luminescent Cell Viability Assay. n = 3. Data represented as mean ± SEM. *P ≤ 0.05; t test comparison test

Similar articles

Cited by

References

    1. Burton GJ, Fowden AL. The placenta: a multifaceted, transient organ. Philos. Trans. R. Soc. Lond. B Biol. Sci. 2015;370:20140066. doi: 10.1098/rstb.2014.0066. - DOI - PMC - PubMed
    1. Baergen Rebecca N. Manual of Pathology of the Human Placenta. Boston, MA: Springer US; 2010. Chorionic Villi: Histology and Villous Development; pp. 69–83.
    1. Castellucci M, Kosanke G, Verdenelli F, Huppertz B, Kaufmann P. Villous sprouting: fundamental mechanisms of human placental development. Hum. Reprod. Update. 2000;6:485–494. doi: 10.1093/humupd/6.5.485. - DOI - PubMed
    1. Jones CJ, Fox H. Ultrastructure of the normal human placenta. Electron Microsc. Rev. 1991;4:129–178. doi: 10.1016/0892-0354(91)90019-9. - DOI - PubMed
    1. Potgens AJ, Drewlo S, Kokozidou M, Kaufmann P. Syncytin: the major regulator of trophoblast fusion? Recent developments and hypotheses on its action. Hum. Reprod. Update. 2004;10:487–496. doi: 10.1093/humupd/dmh039. - DOI - PubMed

Publication types